| ORM has been working alongside family farm businesses now for over 30 years. In some cases those businesses now entering into a phase where a third generation is now becoming involved in the day-to-day operation.
Over the past 10 years, ORM’s client base across both the Wimmera & Mallee has seen through the tough start of the 2010s. Faced with flooding and difficult season-to-season conditions before running into a strong finish as we entered the 2020s. With the last four years on average across the majority of broadacre based Victorian farming regions having just about the best possible conditions for farming as we’ve experienced. |
 |
These strong results have had a significant influence on the balance sheet position of farmers across the Wimmera and Mallee. The “typical family farm” now looks a lot different on paper than what it did just 10 years earlier.
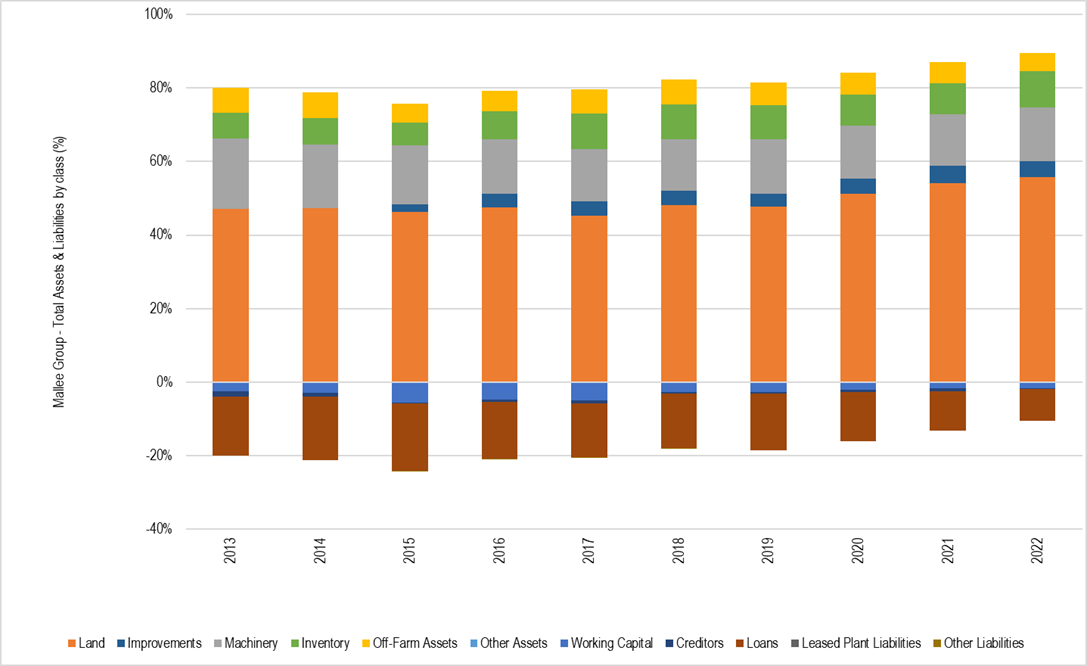
Mallee
We’ve taken a sample of ‘single family farms’ in the Mallee that in 2013 had an average farm scale of 2,240 hectares total cropped area. Land in the sample set of businesses was all owned, with minimal to no lease or share-farming being undertaken. The land was valued at an average price of $1,500/ha, or $3.36mio.
The amount of machinery required to by a business in this sample in 2013 was $1.3 Million or $580 per hectare.
Total debt for the average Mallee farm in 2012 was $1.4M. This translated to a debt-to-land & machinery asset ratio of 30%.
The Significant changes
When we compare this to the current day, it looks different in most areas.
The land price jump has been quite significant with the average price across businesses being at least $5000/ha, and most between 3x and 5x greater than 10 years prior.
There was an average jump in farmed area of 1500ha or 69% to 3800ha over the period. Farmed area for the sample in 2022 now includes an average 800ha of lease and 300ha of share-farm area.
The value of machinery in 2022 was $3.46mio, a 166% increase. In per hectare terms this was $910/ha, an increase of 57% from 2013. Farms have grown to absorb the cost of newer, higher capacity machines, but we can see from the $/ha increase there has been a significant rise in the cost of machinery ownership.
Changes in total debt as a percentage of all land and machinery assets was also surprising with total liabilities increasing by only $1 million as an average across the sample, halving the debt to land and machinery to 15%.
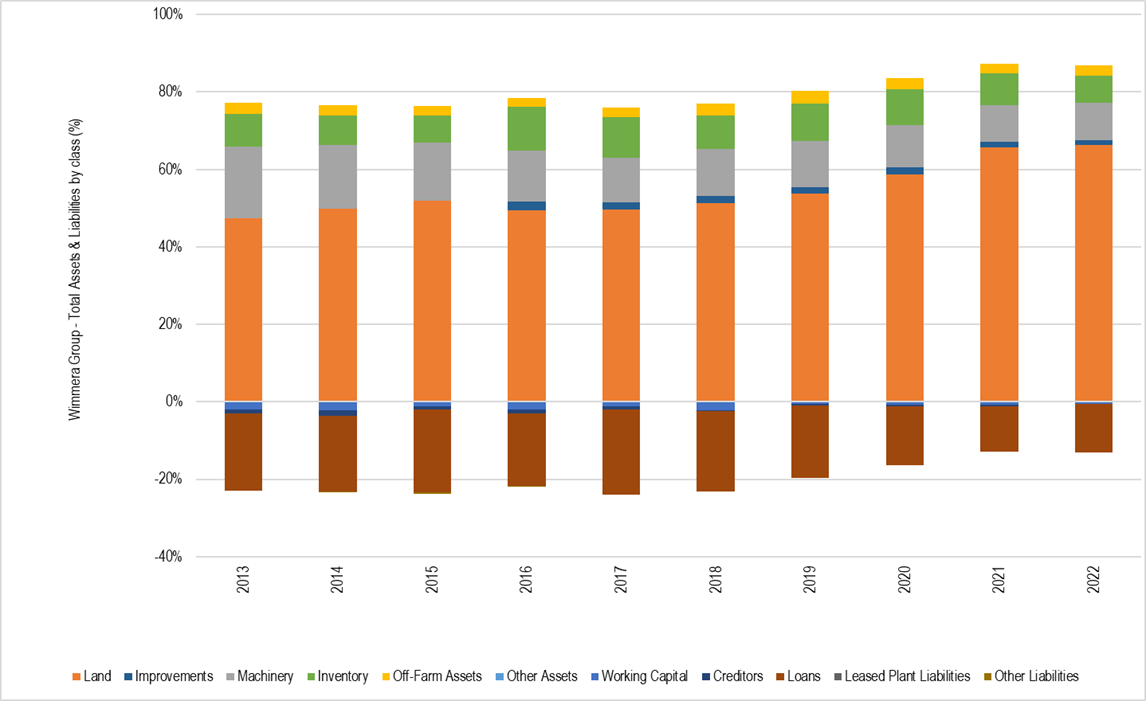
Wimmera
We’ve analysed a similar set of predominantly ‘single family’ Wimmera farm businesses. The sample had an average farmed area of 2250ha in 2013, with 1985ha owned at average values of $2,718/ha giving a total owned land value of $5.39mio.
Machinery value required to farm this average scale was $2.1 million or $963/ha, much higher than the Mallee equivalent (and slightly higher than the Mallee value of machinery of $910/ha in 2022).
This begs the question: What is driving the $383/ha greater spend on machinery between Mallee and Wimmera farms? Could it be the concentration of hay making equipment in the Wimmera sample is much higher than the Mallee?
Total debt in 2013 for Wimmera-based farmers was $2.7 million, or 35% of land and machinery assets as a ratio, 5% higher than Mallee based clients.
The significant changes
The contrast to now is as significant as their Mallee counterparts, as land values jumped to an average of $13,500/ha, circa 5x times greater than 2013 values.
The increase in scale for the Wimmera sample of 780ha, or 35%, to 3028 hectares was only half the increase seen in the Mallee sample. No major change to share-farmed area, but lease and owned area jumped by 435ha and 343ha respectively.
The much higher land price multiplied by the increase in owned area raised the average land value to $30.26mio, whilst the total value of machinery increased to $3.99mio, an 84% increase. While this is a significant increase, it is roughly half the percentage increase of the Mallee sample, and in per hectare terms the increase is only 37% or $355/ha. This shows the machinery investment gap closing between the two samples, and maybe that the Mallee sample was slower to invest in newer, higher capacity machinery and has been catching up over the period.
The average total debt position for the Wimmera sample in 2022 doubled to $5.4 million. Reducing the debt to land & machinery asset ratio to 17%. Again, this is much lower than 10 years prior and indicates that the average business now has a strong security buffer within their businesses.
Comparison Summary
Strong seasons and excess profits have also enabled businesses to diversify into off-farm investments. Something that wasn’t happening 10 years prior across both regions.
Ultimately both regions have been able to significantly improve their ‘balance sheet health”, with growth in equity in real dollar terms as well as % of total assets over the past 10 years. Equity as a percentage of total assets for the Mallee sample increased from 75% to 89%, while the Wimmera sample from 70% to 85%.
ORM will continue to conduct its annual benchmarking comparison reporting and highlighting of trends in all cropping areas of Victoria. If you would like to see how your business compares against peers in your region we encourage you to please get in touch with us.