| ORM was asked to give a presentation at the GRDC Bendigo Grains Research Update in February, on the topic “Are rising input costs the biggest threat to farm profitability?” To respond with some confidence, we analysed the effect of input prices on a set of 20 Victorian cropping businesses in the low to medium rainfall zones (the ‘sample set’) over a period of ten continuous years to see the impact input costs have had. |  |
The findings were:
Input spend
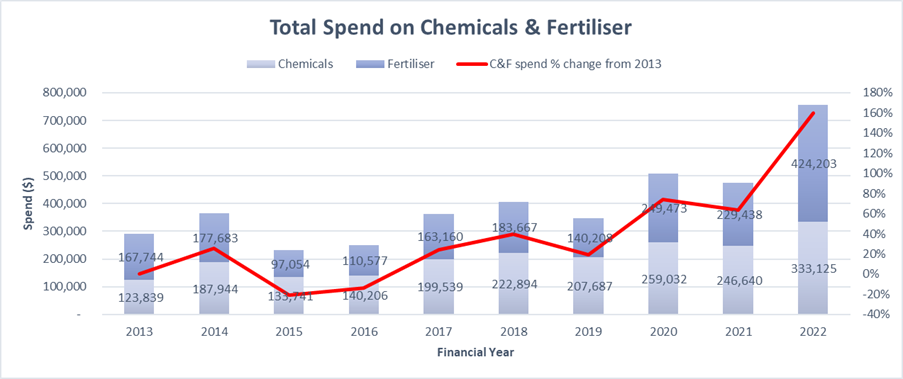
Input spend per farm business had risen significantly. See below average chemical and fertiliser spend from 2013 to 2022.
Although spend on inputs has been rising quickly, input prices are correlated with both crop yields and commodity prices, linking input spend to gross income. Below is chart of Australian Fertiliser and Wheat prices, highlighting the trend.
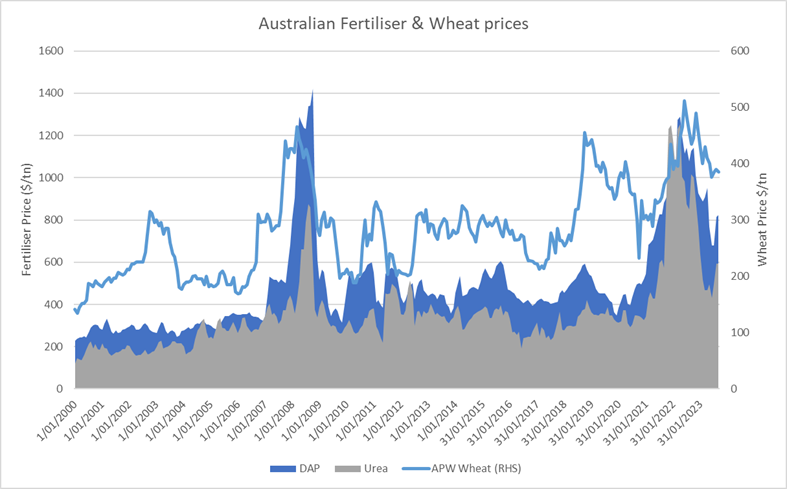
Urea & DAP price source: Indexmundi (Black Sea), bulk, spot, f.o.b. Black Sea in AUD/mt. Wheat price source: Weekly Times
Looking at the sample as a guide to potential spend on inputs, we see that even with the extreme input price volatility, historically the spend on inputs stays within a range of between 26% and 35% of gross crop income.
And once we apply a 3 year rolling average to input prices and returns, as a percentage of gross income, input spend ranged between 28% and 34% of gross income and was unchanged over the 10 year period.
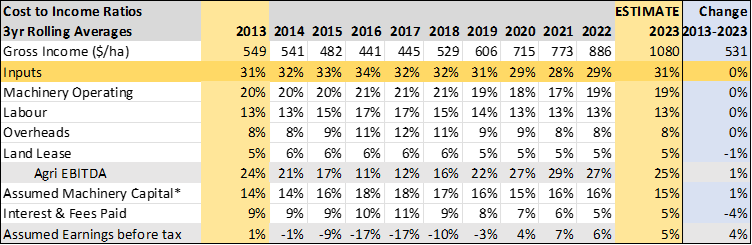
*Assumed machinery capital is based on 12% of total machinery asset value
Fixed costs
– With the help of “Instant Asset Write Off” and low interest rates, we have recently embedded more fixed costs in farm businesses, which pose more of a threat in a poor season than variable costs. It is likely input costs will vary less as a percentage of gross income than more embedded costs of machinery capital expense and interest expense.
– If the sample set were to return to a FY13-FY23 average gross income, machinery capital expense would more than double to 23.4% of gross income – well beyond the 9% range of fluctuations seen in input prices.
Interest expense would also increase 6.5% to 12.4% of gross income, noting that the sample is not particularly exposed to interest rates, with an average equity level of 88% of total assets. The estimate also doesn’t factor interest rates that hit their highs in FY24, and likely underestimates the expense as a percentage of gross income.
If the sample set were to return to an FY13–FY23 average gross :
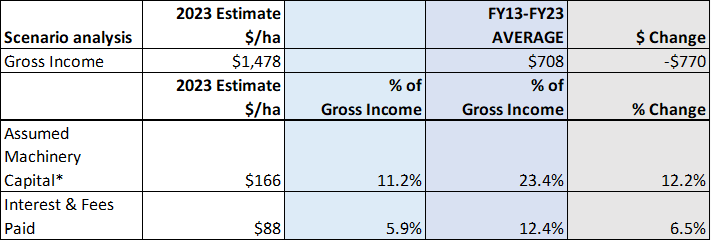
*Assumed machinery capital is based on 12% of total machinery asset value
Countering threats with healthy balance sheets
 |
Recent profitable years and strong equity growth have added significant financial buffer to most farming businesses. In the sample set, total debt had grown, but average debt to asset ratios had halved along with big increases in inventory carried and off-farm assets. |
Summary
Looking at the recent cost trends from the small sample, machinery capital expense and interest expense would seem the greater threat to farm profitability, but it will be different for each business depending on whether that business has expanded recently, taken on debt, upgraded machinery etc. Given the most recent financial positions of the sample set, most businesses appear well positioned to weather short-term hits to profitability.
The best way to counter threats begins with good planning. If you would like help with business planning, please contact ORM here