How are you going?
| You probably have a pretty good gut feel of how your business is going. But is your gut feeling skewed because you like to keep up with the ‘top farmers’ in the district, or because you like machinery and don’t like sheep?
Benchmarks summarise factors in a business in a manner that enables useful comparisons between years and between businesses. They provide an objective assessment of your business, taking the gut feel out of the decision-making process. |
 |
Benchmarks can help identify which parts of your business are working and where opportunities exist. You can find out how the ‘top profit’ farming businesses are doing, to see what is achievable.
|
What are you trying to achieve?But let’s start with the basics – before looking at how your business is performing you need to think about your business and personal goals. A few key factors to consider are:
So, do you want to have the best crop yields, have a better work/lifestyle balance (that suits all in the business ?), minimise the impact of poor seasons, build for the next generation …..? By understanding your own goals, you can then direct your efforts and resources in the right direction. |

The figures are great, but what do they mean?
Data from broadacre farms across Australia (predominately in South Australia, Victoria and NSW) has been collected in the AgProfit® database. Key benchmarks have been developed and ORM consultants use them to focus clients on their business’s strengths and weaknesses (i.e. opportunities ?) and review how that fits with their goals.
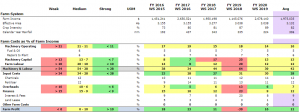
Figure 1 Example of Farm Costs KPIs for an individual business. Source: Ag Profit® 2020
FY = Financial Year, WS = Winter Crop Season
Focus on the 5-year average (Avg column), as this evens out the impacts of poor seasons (e.g. WS2018) and income/costs being spread across financial years for tax planning / cashflow reasons.
Looking at the table above, what can we see?
- Machinery & Labour costs are in the medium range. Machinery Capital (depreciation) is getting toward the Weak range due to recent upgrades to key items, but this is offset by low Labour costs.
- Input costs are strong (ie well matched to production); Finance costs are in the medium range.
What next? Going through the report with others in your business is a great way to encourage communication and invite others to participate in the direction of your business.
|
The review of the report may identify:
|
 |
How to start
Benchmarking only tells part of the story but it is a good way to assess how the business is currently performing.
With the 2020 season almost wrapped up, and the 19/20 financials likely to be completed soon, it is an ideal time to consider being involved in ORM’s free Benchmarking project. We will provide you with a summary of the last five years and a 30-minute meeting with one of our experienced consultants to identify the key issues the business should be addressing.
Get in touch to find out more Contact Us