GRDC Applying for a Tender_V1.2 (1)
You have probably heard a lot about greenhouse gas emissions, with many organisations having made statements about their timeline to carbon neutrality. But you are probably wondering what this means at a farm level.
During 2024 the Treasury Laws Amendment Bill 2024: Climate-Related Financial Disclosure was enacted resulting in additional reporting requirements for the largest businesses in Australia. Many of these businesses by 2027 will be seeking to estimate their scope 3 greenhouse gas emissions in much finer detail.
So, why should farmers care?
| Well, scope 3 greenhouse gas emissions are those associated with a product before it is purchased by a business, so that is the accumulated emissions from the supply chain journey that led to it being purchased by a business. This contrasts with scope 1 and 2 greenhouse gas emissions which are those that result within the control of the business.
When we consider this at farm level, scope 3 greenhouse gas emissions are those resulting from the production and transport etc. of urea, herbicides, fuel, and anything else consumed on farm during farming activities.
|
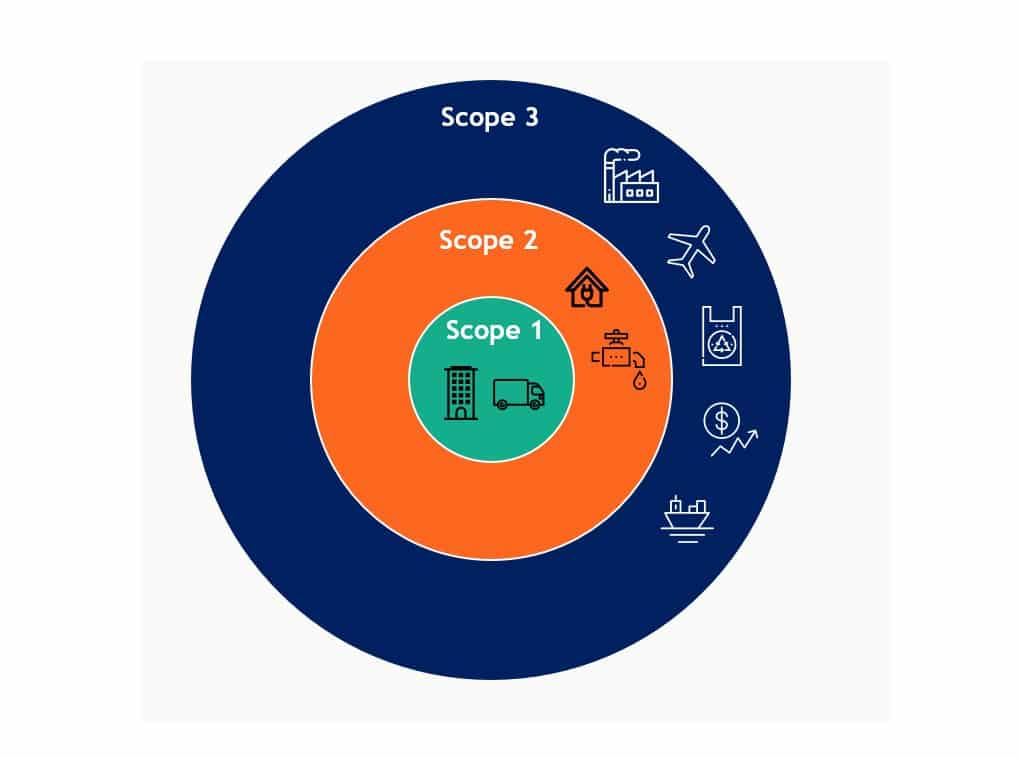 |
While there aren’t many farm businesses in Australia who will meet the turnover ($50 million or more), gross asset ($25 million or more) and employee number (100 or more) threshold for inclusion in the new Climate-Related Financial Disclosure requirements, there are many businesses in the downstream supply chain who will. The clearest example of these are supermarkets.
What impacts are likely throughout the supply chain?
Large organisations involved in the supply and manufacture of food and beverages are going to be asked to provide clear data about the scope 3 emissions of the products they supply. Meaning they will look back up the supply chain to the farm gate, for clearer data about emissions.
In the absence of emissions data, products will be allotted a default value which is generally significantly higher than the real production value.
So, what should farmers do about it?
 |
As large businesses in Australia begin to calculate their emissions, they will begin to look to suppliers to understand their scope 3 greenhouse gas emissions.
We need to begin to educate ourselves to develop a strategic response to the future and form a view on how these changes might impact us directly. The other key thing we can do to prepare, is to make sure we are recording the right production and operational data with an eye to our future needs. For example, we’ll need kilograms of meat or wool and tonnes of grain and hay produced. |
Why we can’t afford to wait until we are asked for emissions data!
This data will become important to also enable the creation of greenhouse gas emissions profiles for farm businesses. As in all farming activities five year rolling averages, will be a better representation of the business than if left to single year of data. We could be placed at a competitive disadvantage, compared to those who are prepared and were ahead of the curve if we don’t start collecting data now.
To find out how ORM can assist in preparing your business, get in touch.
Key Themes
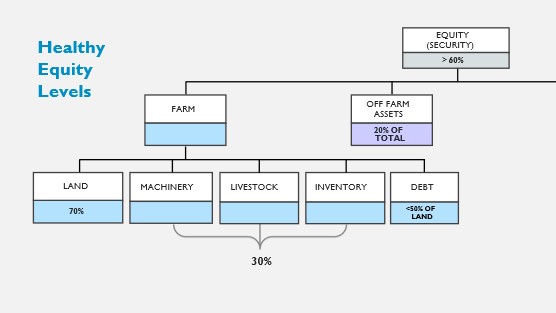
Key themes over the last couple of years for clients are that while cost pressures are real, most have experienced reasonable returns and balance sheets have never looked better.
But the growth in farm asset values has altered clients’ total asset mixes.
While off-farm assets have grown in total dollar terms, as a proportion of total assets they have shrunk. Also, as farmland values have often outpaced earnings growth, returns on farm asset values have contracted.
So many clients are looking at what opportunities are available off-farm, and if they can utilise on-farm equity to build off-farm wealth.
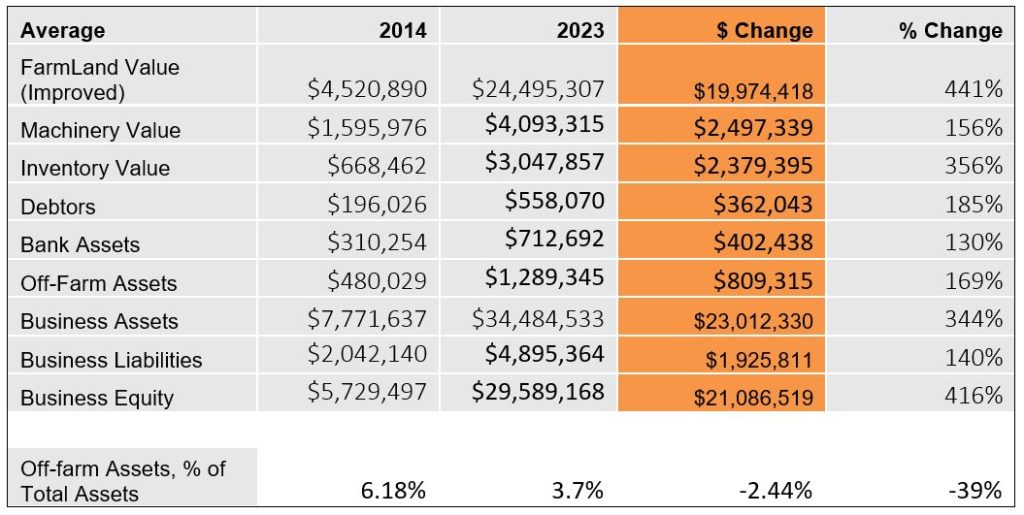
Size of the change
Off-farm assets can provide a diversified income stream for farm business owners, steady income in retirement and useful non-agricultural assets in transition planning.
Looking at a sample of Wimmera and Mallee cropping clients over a 10-year period to 2023, we can start to see the size of the change. Off-farm assets as a percentage of total assets reduced 39% over the period.
Impact of change and planning for transition
Farming families are finding that to attain the same financial split of assets as ten years ago, it often results in the farm having to take on more debt or sell assets.
By planning early and leveraging these stronger levels of equity now, farmers may be able to reduce the pressure on the farm business when it comes to transition later.
If you want to find out more get in touch with ORM, or come see us at the field days at Speed.
The end of Temporary Full Expensing
| Following another favourable season in 2023, many growers are expecting a large taxable income. In the previous 3 financial years, growers had utilised temporary full expensing for capital purchases of new machinery and improvements to reduce their taxable income. With this ceasing in FY23 and most of the machinery now written down to zero value, the deductible depreciation for this financial year is expected to be quite low in comparison. Also, the added dilemma of selling machinery that has been fully depreciated will add to taxable income. |  |
The instant asset write-off of machinery or capital items under $20,000 continues as does full deductions for capital expenses on fencing and fodder storage assets.
Luckily growers have other tax planning options available. So, let’s look at what other options growers have to manage their taxable income.
Grain inventory and pools
According to the ATO any inventory on hand on 30th June intended for sale, needs to be valued using one of these three methods: at cost, market selling value, or replacement value. If your cashbook accounting is ‘cash’ then grain sales are considered income when funds are received. If using ‘accruals’, then once you’ve contracted grain sales with deferred terms it’s considered as income earned at the time of contract. Some pooled products declare and pay income distributions in the next financial year, but not all do this. It’s important to check with businesses before entering into a pool to check the timing of income distributions.
Pre-pay expenses
 |
Another strategy used by farm businesses is pre-paying expenses, such as inputs of chemicals and fertiliser, or interest on term loans. Input providers may also offer incentives for prepaying inputs that can create discounts for future purchases. Interest prepayment is also an option on term debt with a fixed interest rate. |
FMDs
Farm Management Deposits (FMDs) are another handy tool when it comes to tax planning. FMDs must go into individual names. Income received as franked dividends from a Company are not primary production income so if your business operates as a company, you can’t deposit funds into an FMD. Operating as a farming partnership or as a trust (where you are a beneficiary) makes you eligible to use FMDs. The funds must remain invested for at least 12 months to be tax deductible. Each individual can hold up to $800k in FMDs at any given time.
Superannuation
| Concessional contributions into superannuation are a tax-deductible expense. Individuals can make concessional deposits up to $27,500 into their superannuation in this financial year. From 1st July 2024 the limit increases to $30,000 per individual. Also, if you hadn’t been contributing in prior years you can back-date up to 5 years. For example, if you haven’t contributed to super in the last 5 years you could claim concessional contributions of up to $132,500 into super (noting the contribution limit for FY2021 & FY2020 was $25,000). |  |
Summary: What next?
Tax planning meetings with your accountant to manage your taxable income is vital, as everyone’s situation is different and some of the above strategies might not be suitable.
When using any of the above strategies, it’s also important to think about cashflow requirements to keep your trading facilities within its limits. Updating your budget figures during tax planning is essential. If you are budgeted to exceed current limits, contact your bank early to get a temporary extension until income starts flowing through post-June 30th.
ORM assists clients in updating their cashflow budget ahead of tax planning and can provide reports to both accountants and banks as required – contact us here
The rise in land values
| Land values for broadacre cropping areas within Victoria over the last five years have more than doubled for most regions. Over this time seasonal conditions were favorable resulting in strong yields with good commodity prices. So, has farm income kept pace with land values? |  |
Production – Income & Yield
A five-year review of wheat yield and income per hectare for the Wimmera and Mallee from the ORM dataset provides a measure of production for each region. Crop income ($/ha) includes all crops and hay and is before costs. Wheat yield (t/ha) is shown for comparison as the most common crop to all regions.
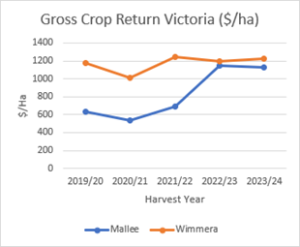
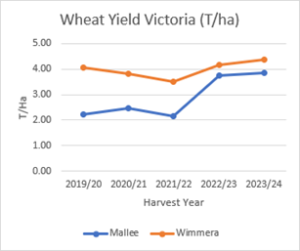
Figure 1 Gross Crop Return – ORM Dataset Figure 2 Wheat Yield – ORM Dataset
The past two years have been particularly strong for the Mallee with wheat yields and income similar to the Wimmera.
Prior to 2022 the spread between the two regions reflected the difference in seasonal conditions and shows a 1.5t/ha difference in wheat yield and $500/ha difference in crop income.
Income as a percentage of land value
Farm income has historically averaged around 18 – 20% of bare land value and was similar across all broadacre cropping regions in Victoria. This ratio measures the production value of the land and can assist when deciding the land value when purchasing.
So, has this ratio stayed in line with historical trends?
Figure 3 Gross Crop Income as % of Land Value
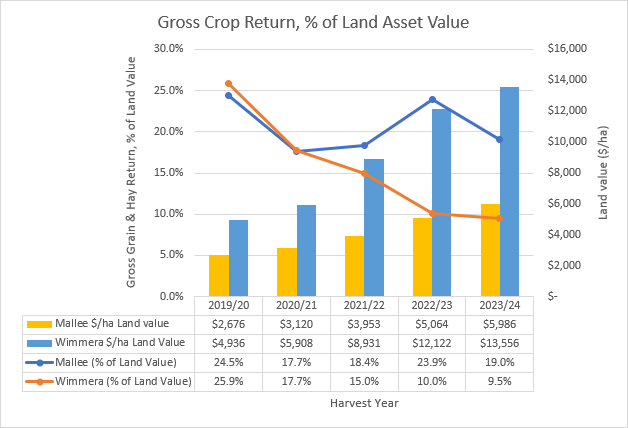
Mallee:
- Maintains a strong ratio at around 20%
- Income in 2022 and 2023 has increased in line with land values.
Wimmera
- Average income of $1,200 per hectare was maintained across the 5 years.
- Land values more than doubled over the 5 years.
Summary: When is this ratio relevant?
The Wimmera region suggests the income to land values ratio is trending downward. This ratio doesn’t impact the profitability of the existing assets, rather it becomes relevant when individual businesses are assessing their capacity to expand.
If borrowing for a new land purchase and the income to land value ratio has halved, the income generated from the dollars spent to purchase new land is half what it was previously, so serviceability of this new debt becomes the issue. Unless income from the new land can increase to achieve closer to the 20% ratio then it’s likely the business will require good profits from the existing land to cover the interest cost on the new debt.
The positive to come from rising land values is the increased land asset value available as security. This additional security can support new asset purchases while also providing a strong financial buffer if needed to cover trading losses in a low-income year.
If you’d like to check your ratios and financial buffers, ORM can help – contact us here
| ORM was asked to give a presentation at the GRDC Bendigo Grains Research Update in February, on the topic “Are rising input costs the biggest threat to farm profitability?” To respond with some confidence, we analysed the effect of input prices on a set of 20 Victorian cropping businesses in the low to medium rainfall zones (the ‘sample set’) over a period of ten continuous years to see the impact input costs have had. |  |
The findings were:
Input spend
Input spend per farm business had risen significantly. See below average chemical and fertiliser spend from 2013 to 2022.
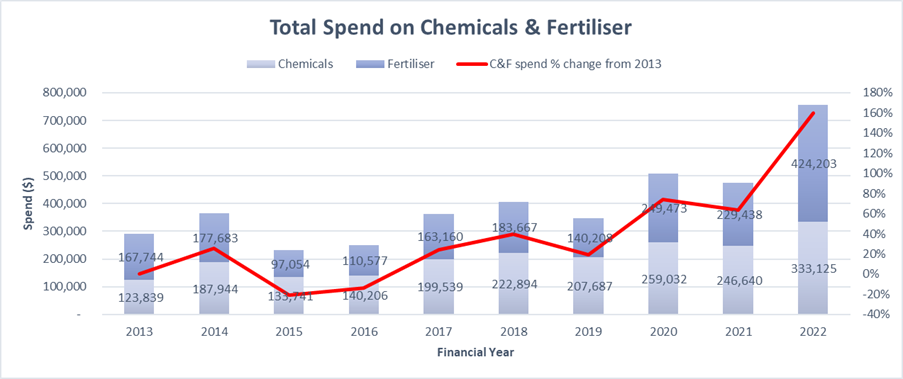
Although spend on inputs has been rising quickly, input prices are correlated with both crop yields and commodity prices, linking input spend to gross income. Below is chart of Australian Fertiliser and Wheat prices, highlighting the trend.
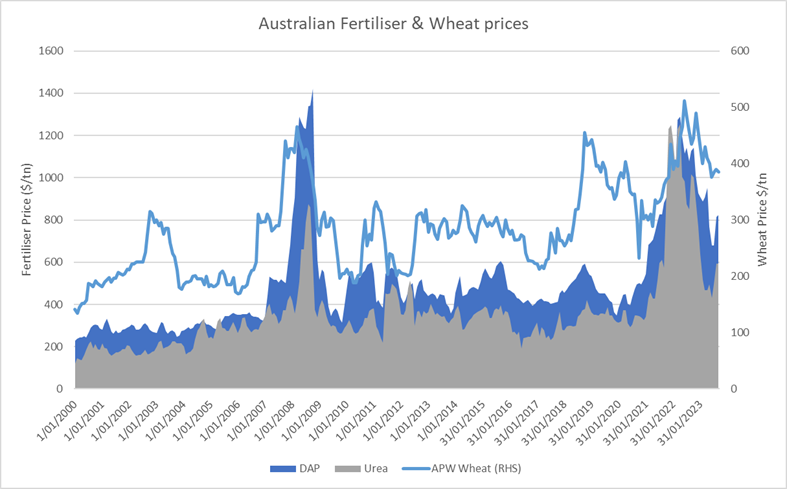
Urea & DAP price source: Indexmundi (Black Sea), bulk, spot, f.o.b. Black Sea in AUD/mt. Wheat price source: Weekly Times
Looking at the sample as a guide to potential spend on inputs, we see that even with the extreme input price volatility, historically the spend on inputs stays within a range of between 26% and 35% of gross crop income.
And once we apply a 3 year rolling average to input prices and returns, as a percentage of gross income, input spend ranged between 28% and 34% of gross income and was unchanged over the 10 year period.
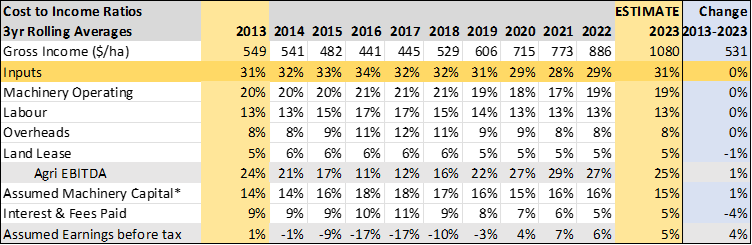
*Assumed machinery capital is based on 12% of total machinery asset value
Fixed costs
– With the help of “Instant Asset Write Off” and low interest rates, we have recently embedded more fixed costs in farm businesses, which pose more of a threat in a poor season than variable costs. It is likely input costs will vary less as a percentage of gross income than more embedded costs of machinery capital expense and interest expense.
– If the sample set were to return to a FY13-FY23 average gross income, machinery capital expense would more than double to 23.4% of gross income – well beyond the 9% range of fluctuations seen in input prices.
Interest expense would also increase 6.5% to 12.4% of gross income, noting that the sample is not particularly exposed to interest rates, with an average equity level of 88% of total assets. The estimate also doesn’t factor interest rates that hit their highs in FY24, and likely underestimates the expense as a percentage of gross income.
If the sample set were to return to an FY13–FY23 average gross :
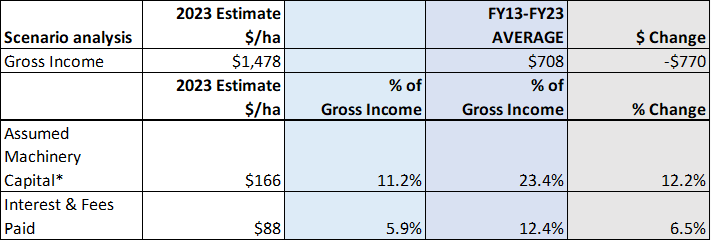
*Assumed machinery capital is based on 12% of total machinery asset value
Countering threats with healthy balance sheets
 |
Recent profitable years and strong equity growth have added significant financial buffer to most farming businesses. In the sample set, total debt had grown, but average debt to asset ratios had halved along with big increases in inventory carried and off-farm assets. |
Summary
Looking at the recent cost trends from the small sample, machinery capital expense and interest expense would seem the greater threat to farm profitability, but it will be different for each business depending on whether that business has expanded recently, taken on debt, upgraded machinery etc. Given the most recent financial positions of the sample set, most businesses appear well positioned to weather short-term hits to profitability.
The best way to counter threats begins with good planning. If you would like help with business planning, please contact ORM here
|
|
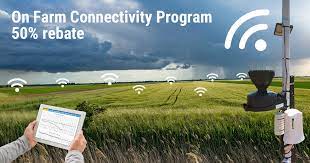
Have you recently thought about improved security around the back sheds. Or wondered how much the rainfall differs between home and the back block. Well, now might be your chance to increase your on farm connectivity capabilities, accessing a rebate supplied by the Australian Government.
The rebate is provided through – The On-Farm Connectivity Program. The program is part of the Better Connectivity for Rural and Regional Australia Plan for farmers. |
About the Program
To be eligible your average annual gross income must be between $40,000 and $2 million based on the previous 3 full financial years.
The objective of the plan is to increase access to digital agribusiness solutions, that support increased productivity or promote better safety practices.
The program intends to run over the next 2 years. It will be implemented in stages. In stage 1 currently operating, there is $15 million, with the closing date being 31st May 2024 or until funding is exhausted.
You will need to deal with an eligible equipment supplier. A list can be found at: On Farm Connectivity Program List of eligible equipment suppliers PDF
Eligibility criteria for primary producers
To be eligible, the primary producer must:
- Have an ABN
- Carry out the primary production activities listed
- Have an average annual gross income between $40,000 and $2 million over the previous 3 full financial years.
- Not be a hobby farmer.
Further information about the program can be found at: https://business.gov.au/grants-and-programs/on-farm-connectivity-program#at-a-glance.
An example of the eligible items are:
- Connectivity Equipment:
- Antennas
- Radio Transmitters
- Boosters
- Environmental Monitoring
- Soil Moisture Probes
- Weather Monitors
- Plant growth monitors
- Water flow, pressure & quality monitors
- Farm Management
- Cameras
- Asset Trackers
- Battery monitors
- Silo & Storage monitors
- Livestock monitoring systems
| ORM has been working alongside family farm businesses now for over 30 years. In some cases those businesses now entering into a phase where a third generation is now becoming involved in the day-to-day operation.
Over the past 10 years, ORM’s client base across both the Wimmera & Mallee has seen through the tough start of the 2010s. Faced with flooding and difficult season-to-season conditions before running into a strong finish as we entered the 2020s. With the last four years on average across the majority of broadacre based Victorian farming regions having just about the best possible conditions for farming as we’ve experienced. |
 |
These strong results have had a significant influence on the balance sheet position of farmers across the Wimmera and Mallee. The “typical family farm” now looks a lot different on paper than what it did just 10 years earlier.
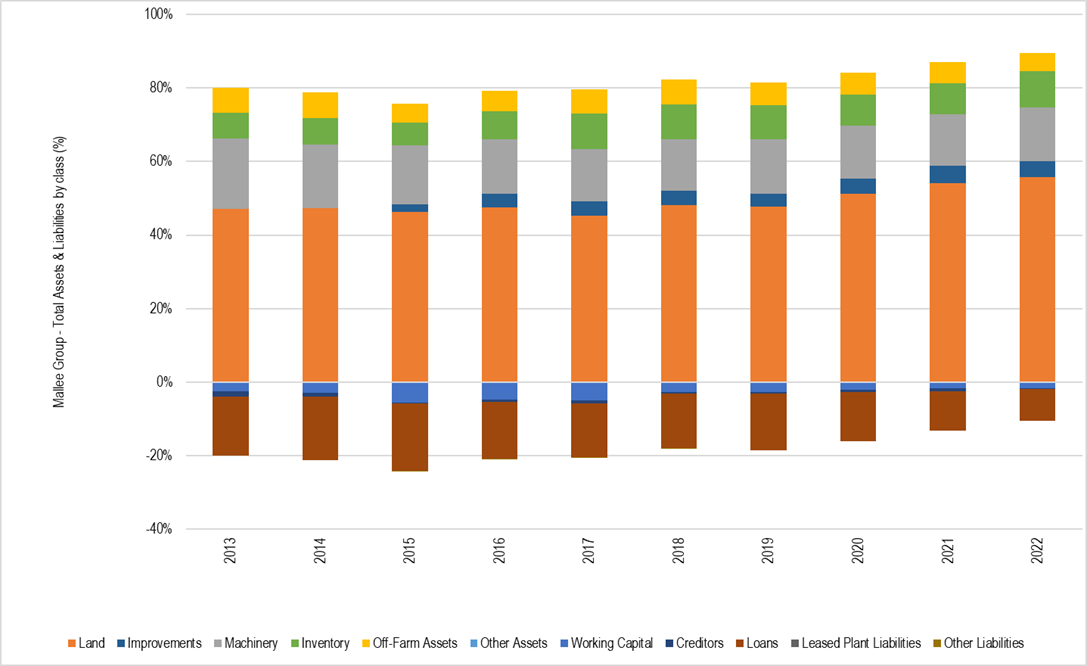
Mallee
We’ve taken a sample of ‘single family farms’ in the Mallee that in 2013 had an average farm scale of 2,240 hectares total cropped area. Land in the sample set of businesses was all owned, with minimal to no lease or share-farming being undertaken. The land was valued at an average price of $1,500/ha, or $3.36mio.
The amount of machinery required to by a business in this sample in 2013 was $1.3 Million or $580 per hectare.
Total debt for the average Mallee farm in 2012 was $1.4M. This translated to a debt-to-land & machinery asset ratio of 30%.
The Significant changes
When we compare this to the current day, it looks different in most areas.
The land price jump has been quite significant with the average price across businesses being at least $5000/ha, and most between 3x and 5x greater than 10 years prior.
There was an average jump in farmed area of 1500ha or 69% to 3800ha over the period. Farmed area for the sample in 2022 now includes an average 800ha of lease and 300ha of share-farm area.
The value of machinery in 2022 was $3.46mio, a 166% increase. In per hectare terms this was $910/ha, an increase of 57% from 2013. Farms have grown to absorb the cost of newer, higher capacity machines, but we can see from the $/ha increase there has been a significant rise in the cost of machinery ownership.
Changes in total debt as a percentage of all land and machinery assets was also surprising with total liabilities increasing by only $1 million as an average across the sample, halving the debt to land and machinery to 15%.
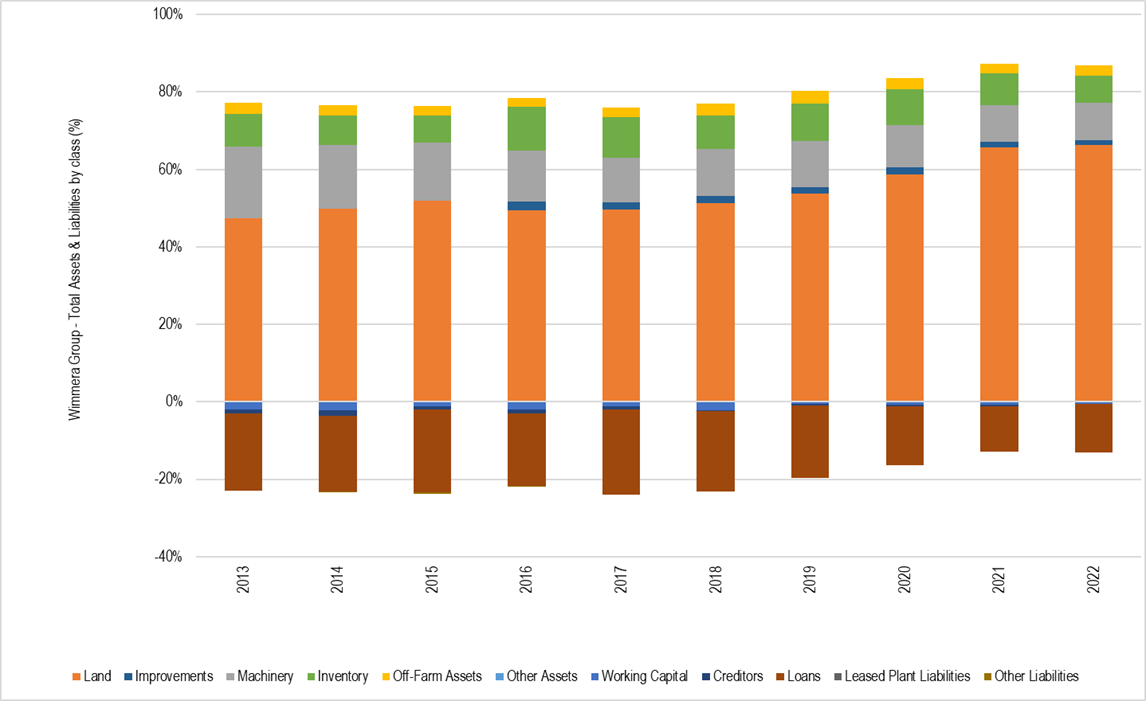
Wimmera
We’ve analysed a similar set of predominantly ‘single family’ Wimmera farm businesses. The sample had an average farmed area of 2250ha in 2013, with 1985ha owned at average values of $2,718/ha giving a total owned land value of $5.39mio.
Machinery value required to farm this average scale was $2.1 million or $963/ha, much higher than the Mallee equivalent (and slightly higher than the Mallee value of machinery of $910/ha in 2022).
This begs the question: What is driving the $383/ha greater spend on machinery between Mallee and Wimmera farms? Could it be the concentration of hay making equipment in the Wimmera sample is much higher than the Mallee?
Total debt in 2013 for Wimmera-based farmers was $2.7 million, or 35% of land and machinery assets as a ratio, 5% higher than Mallee based clients.
The significant changes
The contrast to now is as significant as their Mallee counterparts, as land values jumped to an average of $13,500/ha, circa 5x times greater than 2013 values.
The increase in scale for the Wimmera sample of 780ha, or 35%, to 3028 hectares was only half the increase seen in the Mallee sample. No major change to share-farmed area, but lease and owned area jumped by 435ha and 343ha respectively.
The much higher land price multiplied by the increase in owned area raised the average land value to $30.26mio, whilst the total value of machinery increased to $3.99mio, an 84% increase. While this is a significant increase, it is roughly half the percentage increase of the Mallee sample, and in per hectare terms the increase is only 37% or $355/ha. This shows the machinery investment gap closing between the two samples, and maybe that the Mallee sample was slower to invest in newer, higher capacity machinery and has been catching up over the period.
The average total debt position for the Wimmera sample in 2022 doubled to $5.4 million. Reducing the debt to land & machinery asset ratio to 17%. Again, this is much lower than 10 years prior and indicates that the average business now has a strong security buffer within their businesses.
Comparison Summary
Strong seasons and excess profits have also enabled businesses to diversify into off-farm investments. Something that wasn’t happening 10 years prior across both regions.
Ultimately both regions have been able to significantly improve their ‘balance sheet health”, with growth in equity in real dollar terms as well as % of total assets over the past 10 years. Equity as a percentage of total assets for the Mallee sample increased from 75% to 89%, while the Wimmera sample from 70% to 85%.
ORM will continue to conduct its annual benchmarking comparison reporting and highlighting of trends in all cropping areas of Victoria. If you would like to see how your business compares against peers in your region we encourage you to please get in touch with us.
With harvest quickly approaching, casual workers and contractors will begin working/operating in your business over the coming months. Its important to be upfront about your expectations in the workplace from the very beginning of their employment.
Effective Induction
| Employers have a legal obligation to provide a safe work environment for everyone. Induction is an important tool in providing employees with information about the risks and hazards they will be exposed to on farm; what your key farm policies are and why they are important for safety. Undertaking an effective induction process will be appreciated by employees/contractors, as they will feel you prioritise their safety. |  |
ORM is currently delivering the Safer Farms Families Futures (S3F) program with funding provided by WorkSafe. S3F aims to accelerate the adoption of improved work health safety on broadacre cropping farms. One of our first activities for participants provided training and resources to facilitate the induction process. One of the key take outs that participants reflected on was, how important induction is for informing farm safety policies and processes, creating a positive work culture, which in turn will make you an employer of choice.
Reasonable Approach
When recruiting and inducting new employees the below steps outline a reasonable approach:
- If you don’t have one, create a position description – this will ensure you hire the right person and set clear job expectations with roles and responsibilities outlined.
- When you have a successful application send them a letter of offer to sign and return when they commence working for you.
- On their first day provide them with:
- Employment contract (2 copies, sign both and you each keep a copy).
- Fair Work Statement and if casual, Fair Work Casual Employment Information Statement.
- Timesheet recording method.
- They will need to provide you with the following:
- Contact information (name, phone, address, email)
- Bank, superannuation and tax file number details
- Emergency contact information – save their emergency contact to your phone
- Pre-existing injuries
- Evidence of any relevant licenses (e.g. drivers licence, truck licence).
Expectations & Policies
- To set your expectations with the new employee, provide and discuss your key policies:
- Golden Rules (addresses farm-related critical risks to the employee)
- Code of Conduct
- Health and Safety
- Mobile phone usage while at work
- Drug and Alcohol (including your policy around smoking at work)
- Working remotely or alone
- Rules for children on farm
- Clean and tidy workplace
- Animal welfare
- Work vehicle usage agreement
- Any other relevant policies to your business.
The above can be done in an office setting over a few hours.
 |
Once you have set out the key guidelines, take them on a tour of the workplace to familiarise them with the farm, introduce them to other employees and provide them with any required PPE gear and a place to store it. |
Provide them with a property map, that identifies paddock names/locations and highlights any hazards, such as powerlines, dams. Also provide them with a list of emergency contacts i.e. managers number, local hospital/police/fire numbers. A useful app for farm employees is called Emergency Plus. It was developed by Australian emergency services and uses GPS functionality to help emergency services locate you in an emergency.
Machinery Operation
|
Depending on the work they will be doing, you’ll need to show them how to safely operate machinery and ensure to provide supervision as part of the training process, e.g. headers, augers, balers etc. Remembering to document this with the employee acknowledging they understand and can competently operate the machine in a safe manner. |
 |
A core aspect of meeting your WHS obligations is that:
- Machinery is safe to operate and
- The operator was adequately trained in the safe operation of each piece of equipment.
Start with the basics and continue to build on your systems and processes for inducting people into your farm. There are a lot of resources available online that can be used to get started.
There are multiple resources online for the above policies including these websites:
Ag Health Aus https://aghealth.sydney.edu.au/resources/resources-for-farmers/
People in Dairy https://thepeopleindairy.org.au/eski/
People in Ag https://www.peopleinag.com.au/
These resources can be edited to personalise to your business requirements, and they should always reflect the work practices and behaviours that you expect employees to comply with.
Rebecca Sexton, Business Consultant
For any further assistance for inducting staff – phone us on 03 5441 6176 or email us admin@orm.com.au
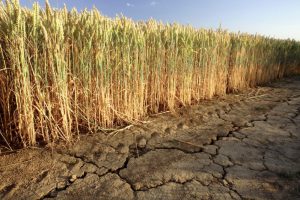
Good rains during Winter have kept soil moisture at favorable levels with crops in most areas of Victoria and Southern NSW doing well. However, planning for the unexpected can be helpful, so some growers are doing the sums on hay as an option if grain yields are impacted by unfavorable weather events.
Updated outlook
The Bureau of Meteorology updated its seasonal outlook and is continuing to forecast a possible El Nino which is likely to impact September-October weather events.
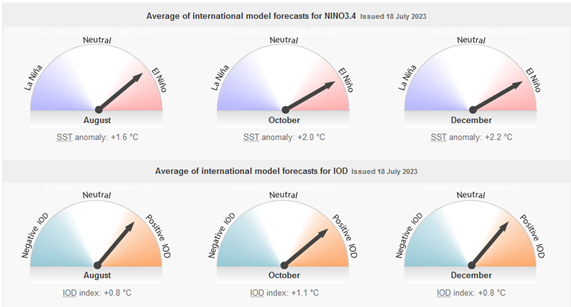
Bureau of Meteorology: 15th August 2023 [http://www.bom.gov.au/climate/enso/]
A dry Spring may impact grain yields hence the option for hay becomes more relevant.
Decision making & risk
 |
If Spring brings with it some unfavorable weather events, then to “cut or not to cut” may be a decision to make. Those that have access to either their own haymaking equipment or a capable contractor, may look to salvage the biomass and not risk the reduction to grain yield based on lack of moisture or heat stress at the back end of the season.
|
Ultimately the decision comes down to an assessment of the variables including weather outlook and its impact on grain yield potential. Intertwine this with each businesses own experience with hay and attitude towards risk. This will be the key determinate as to how each farm will forge a pathway towards more grain harvested or switching to more hay baled.
When is hay an option?
|
Demand for grain & hay locally and internationally will drive the fundamentals behind the prices, however making sure to weigh up the cost to harvest and ability to store either product effectively is important. |
 |
The following graph shows the breakeven yield for grain when compared to hay.
The assumptions for this comparison are:
- Crop stage is at a point where the only remaining cost for each crop is harvest/haymaking.
- Hay yield is assumed to be 5 tonne per hectare.
- Hay harvest and storage cost is $50 per tonne.
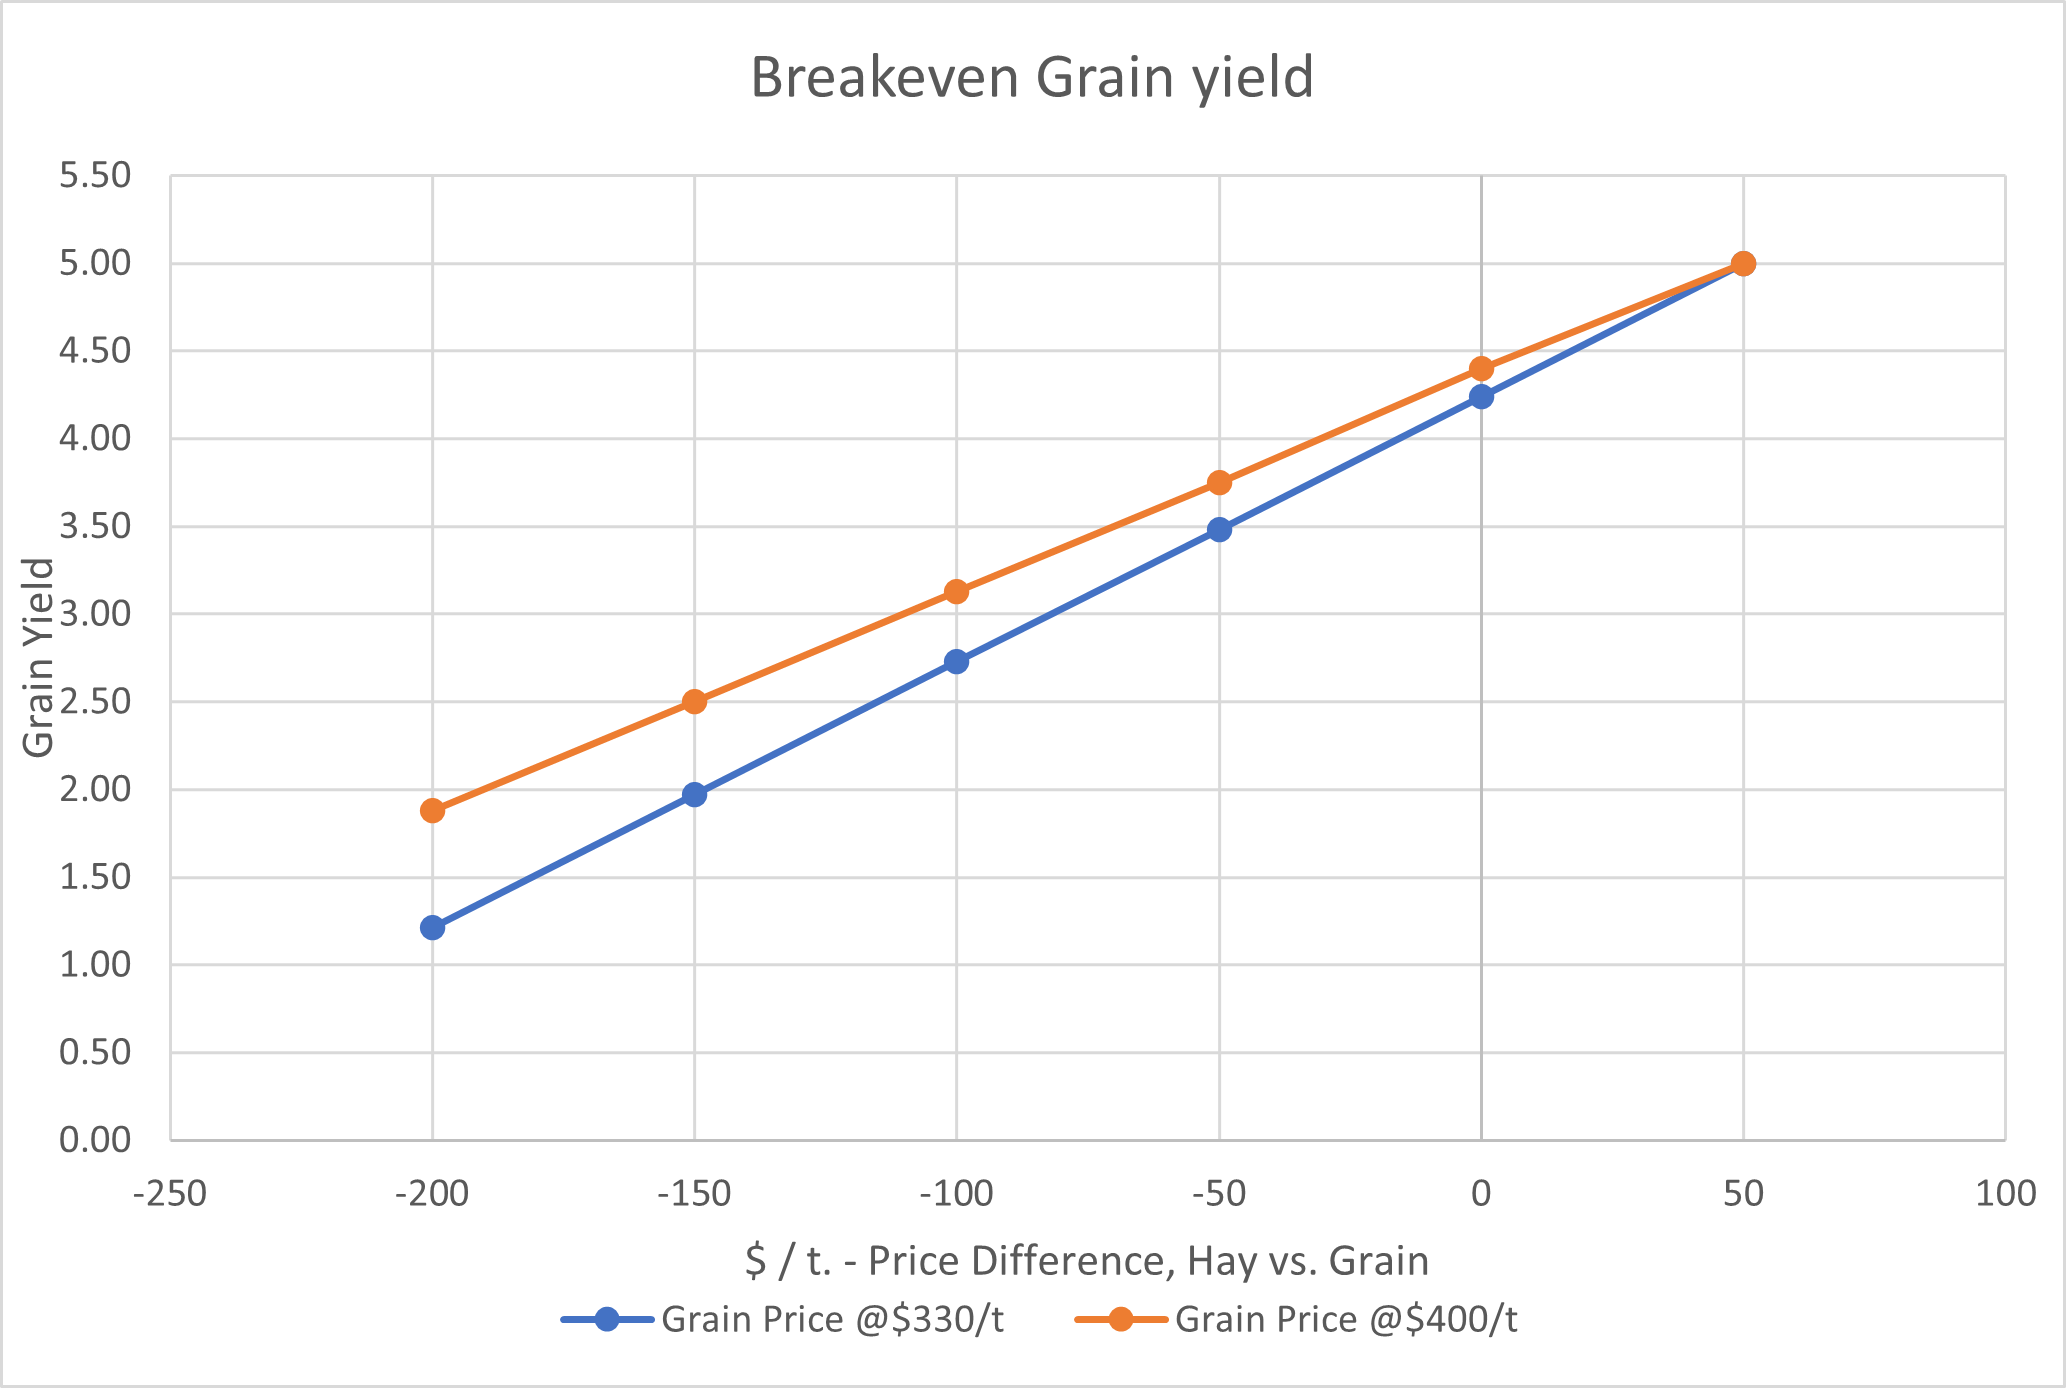
The grain breakeven yield becomes less as the difference between hay and grain price widens.
As a general guide, if grain yield drops below 50% of hay yield, then it becomes economic to consider hay. This will vary depending on estimated hay yield and quality of the hay.
If the hay price reaches $50/t higher than grain, then the extra cost of haymaking is covered, and hay becomes an attractive option.
Summary
When grain yield is less than 50% of hay yield, switching from grain to hay may provide a good economic outcome. However other factors such as markets for hay, availability of haymaking machinery or contractors, extra labour required for handle hay, available hay storage and attitude to risk of weather damage to either grain yield or hay quality, will be key factors to consider when making the ‘hay vs. grain’ decision.
Some farms are well set up and can swing to hay easily, others are not. If you think hay is an option, do some early planning now so you’re ready if needed.
For more information – phone us on 03 5441 6176 or email us admin@orm.com.au
The adage ‘good help is hard to find’ is seemingly more correct than ever. Farms requiring employees are left scratching their heads unsure why they cannot attract the right staff, or encourage current staff to maintain an expected level in the workplace. Perhaps it is time for some businesses to take a step back and delve further into their everyday workplace culture and the policies that are involved within this. Recently at the GRDC Farm Business Updates, Denise McLellan discussed the topic of communicating your workplace expectations with employees and how to induct a new employee.
Induction
Denise expressed to undertake a ‘solid induction’, the employer should first take some time to reflect on the businesses activities and the culture that is associated with the business.
| As the head of a business the culture is reflective of the standards you set, and a meaningful induction allows the employee to feel valued and safe. You need to ask yourself, what do you want the business to look like? Once this reflection is completed and personal standards have been set, successful inductions can be started. |  |
There are some great free induction resources available online, such as the Induction checklist on the People in Ag website which elaborates the areas that you should cover. These include:
- Introduction to the farm business
- Terms and conditions of employment
- Paperwork
- Rosters
- Company Policies
- OH&S Policies
- Emergency Procedures
- Operating machinery
- Farm Tour
- Introductions to other staff members
Code of Conduct
A main part of the introduction is to make the new employee aware of the ‘code of conduct’. Your code of conduct is vital in the development of workplace culture and enables a reference point for future discrepancies that may arise, most likely during the busy periods such as seeding and harvest.
 |
The code of conduct simply operates by informing the employee what you expect from them, regarding punctuality, communication, teamwork, work ethic and policies surrounding drug, alcohol and mobile phone use etc. It might be valued to you to have tidy farm vehicles, so on Friday afternoons you cleaned out the farm utes, or think it is important to connect with your employees so perhaps you will have a drink after work on a Friday. Ultimately, if an employee is understanding of what the requirements are of them within the business, they are more likely to act in the best interests of the business.
|
“People don’t do what we expect, they do what we accept” – House Paddock Training
Reward good people
Another point that Denise McLellan rose was “How do we reward our people”? Employees are likely to be happy with the workplace standards and go that extra mile if there is an incentive. Not all rewards have to be monetary, and it can vary from person to person. As Denise stated, some employees may enjoy finishing early on Fridays to take their kids to swimming or pick them up from school.
| Happy employees can make a huge difference in the day-to-day operations of the business and makes the employers job easier. If you are thinking about completing an induction with current employees or need help developing a ‘code of conduct’, contact us at ORM. |  |
James Naughton, Graduate Business Analyst
For more information – phone us on 03 5441 6176 or email us admin@orm.com.au
I was recently discussing with my builder friend how good and useful general building tools have become. Asking what he spends on tools a year, he replied, ‘while they’re expensive, they are worth every cent’. We often assume the same goes for farm machinery.
Many farmers are experiencing some of the best years on record, but along with this increase in income, we are also seeing farm machinery prices continue to increase. At what stage or price does machinery become not ‘worth every cent’?
Perfect Storm
In many areas there has been a perfect storm in recent years of good commodity prices, good seasons, low interest rates and generous tax incentives, that have culminated in tractor sales increasing by nearly 54% from 2019 to 2022.
| According to Agriview data presented at the GRDC Farm Business Updates in March, tractor unit sales increased from circa 10,000 in 2019 to just under 18,000 in 2022. The value of tractor sales reportedly increased even more, from 1.3 billion in 2019 to just over $2 billion in 2022, with the biggest increase in sales value experienced was in the 200-plus horsepower category. |  |
Analysis
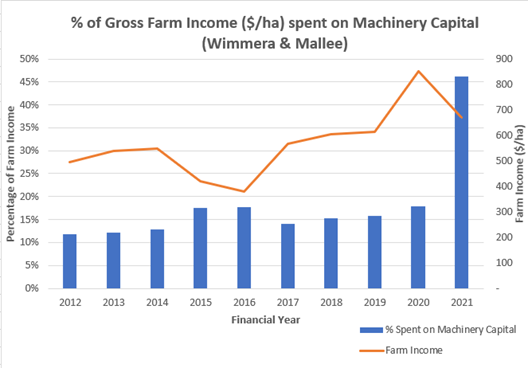
At ORM, we conducted an analysis of businesses throughout the Mallee and Wimmera regions and how much they’ve spent on machinery capital as a percentage of their gross income over a 10-year period.
In the focus group, the effective production area was an average of 3262 hectares, which drove the average income over the 10-year period to $569/ha and the average spend on machinery capital to $106/ha. This resulted in an average percentage of farm income spend on machinery capital of 18.63%. This had grown from 12% in 2012 and peaked at 46% in 2021, a figure distorted by the introduction of the Instant Asset Write Off (IAWO) scheme and the related spike in machinery purchases. If we included 2022 figures, the distortion would be even more pronounced. If we remove the 2021 figures (which in turn removes the effect of the IAWO) and calculate the 9-year average, the percentage of farm income spent on machinery capital was 15%. The operating costs that are related to machinery (fuel and machinery repairs) in 2012 was 12.9% of farm income, while in 2021 it was 9.9%.
Comparing the Machinery Spend
We also looked at the top 25% most profitable businesses over the 10-year period in the Mallee and Wimmera group and compared their machinery spend to the overall group.
 |
We found that the average income of the top 25% was no higher than the whole group ($561/ha), but the increased profitability of the group was driven by better cost control. The top 25% had average expenditure on machinery capital of $93/ha (16.6% of gross farm income), $13/ha less than the whole Wimmera and Mallee average. Interestingly, the top 25% were also able to reduce expenditure on cost areas like fuel, repairs (down 27% on whole group average) and a 62% reduction in hired contracting costs when compared to the entire Mallee and Wimmera group. |
The New Dynamic
The perfect storm of the previous 3 years seems to be clearing, with interest rates rising, inputs costing more and current generous temporary full expensing measures coming to an end. While the government announced in the recently released budget that from 1st July 2023 small businesses will be able to immediately deduct the full cost of eligible assets costing less than $20,000 (including GST), it will be interesting to watch what happens in machinery markets post the changes in tax treatment. And in the longer term, we will be keenly observing if machinery capital expenses return to 10 – 12% of average gross farm income, or if we have entered a new dynamic in machinery expenses? Only time will tell if the investment in machinery over the last 3 years is well and truly ‘worth every cent’.
James Naughton, Graduate Business Analyst
For more information or your own farm analysis contact us on 03 5441 6176 or email us here admin@orm.com.au
As early autumn break rain events move their way across Victoria, signaling a bright start to the upcoming winter season, it can be quickly forgotten how monumental 2022/23 harvest was.
From the business reviews we have conducted with our clients, some experienced their highest crop returns on record, while others were closer to average.
ORM has compared the results from four rainfall zones in Victoria and the seasonal results produced by each zone.
Summary of findings:
The chart below represents the Gross Income per hectare over a 5-year period for four distinct rainfall zones.
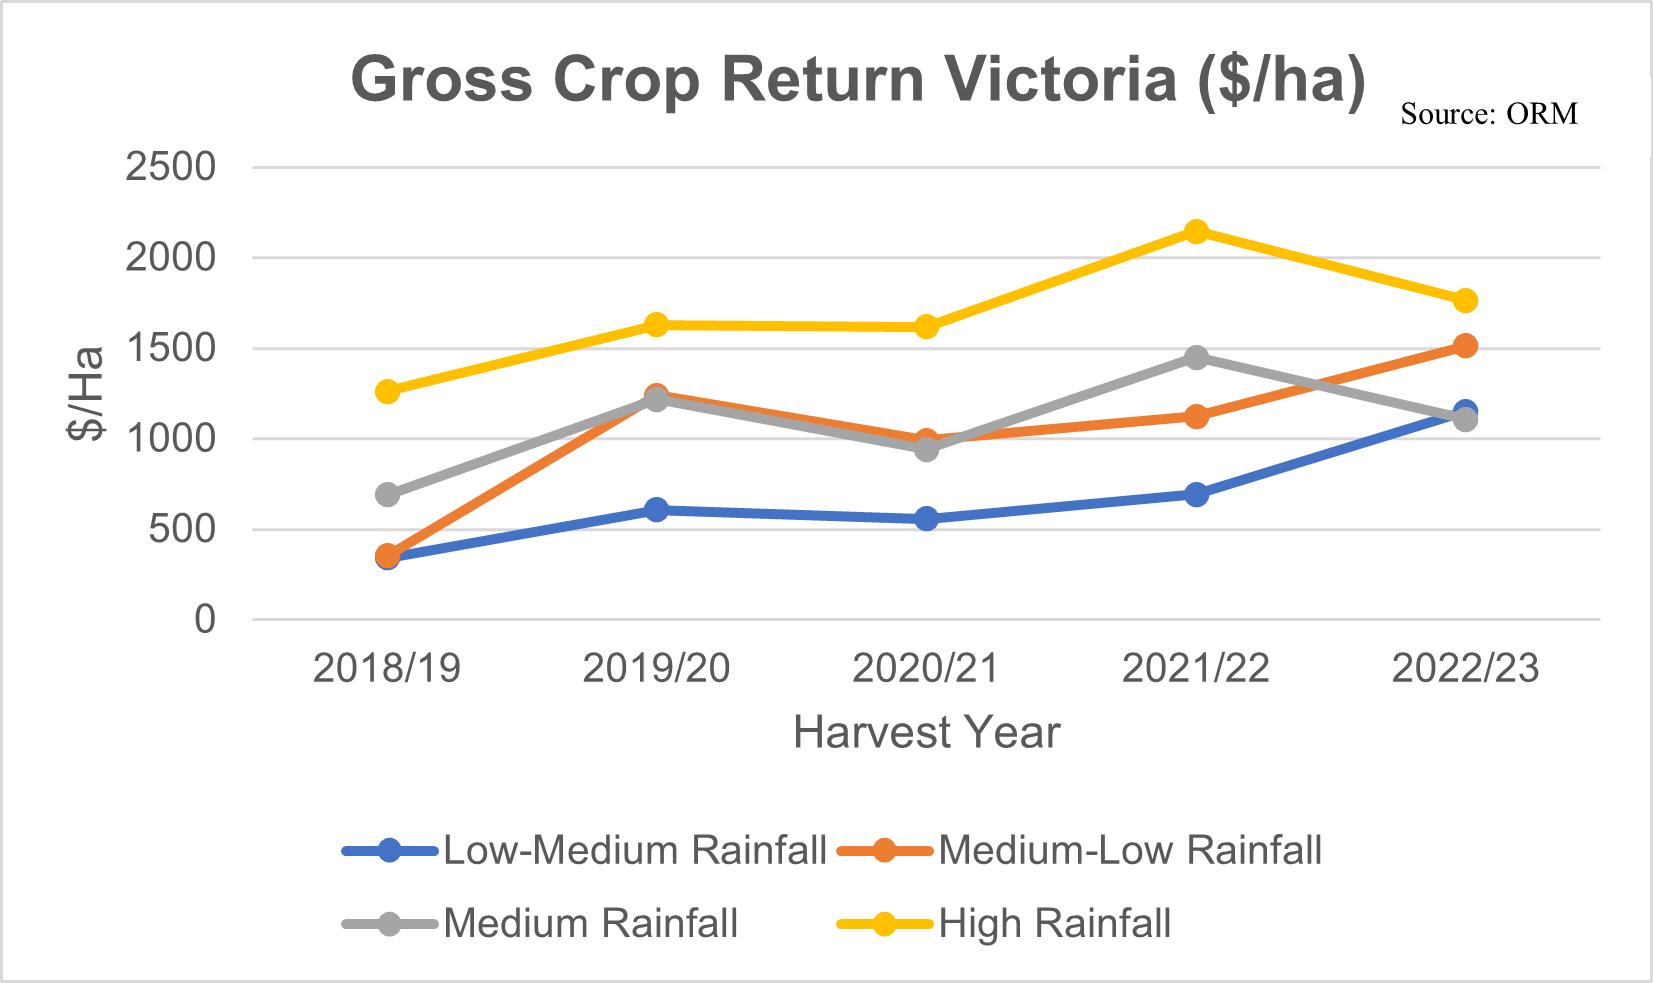
| Gross crop returns broadly increase with rainfall zone, with the largest exception being the 2022 Winter season, where the medium to low rainfall zone outperformed the medium rainfall zone.
This was due to the medium to low rainfall zone receiving similar rainfall to the medium rainfall zone in 2022, while the area did not suffer as many waterlogging issues. We also observe the two higher rainfall zones saw a decrease in gross crop returns year on year, the lower rainfall areas saw an increase, and the gap between the four zones was the smallest over the five-year period. |
 Recent and Historical Rainfall Maps 01/01/2022 to 31/12/2023 |
Seasonal trends are described in more detail below. Look for your rainfall region below and see how you compare.
Low-Medium Rainfall
 |
This area saw a reduction in cereal grain planted in 2022, displaced by legume grain increases as the transition out of growing oilseeds became more prevalent. The 2022 Winter season experienced a growing season rainfall that was 302mm above the 5-year average as well as a stored moisture content that was higher than the year before which in turn pushed the overall crop return towards the $1200/ha mark. Wheat yields in the rainfall group were the highest on our records sitting just above 3.5t/ha. |
The previous best yielding years were the 2016 and 2010 winter seasons, which both recorded similar wheat yields, however prices in these years were considerably lower.
Medium-Low Rainfall
The 2022 winter season much, like the Low-Medium rainfall zone, experienced a larger area to legumes than the previous year and area to cereal grain was the lowest of the last 5 years. Oilseed area remained similar to previous 2 years. During 2022/23 harvest, farmers were inclined to store grain production and await better prices, as the amount of grain stored was upwards of 60% of their overall production, a level of storage not seen for 4 years. The crop return was close to $1600/ha which was $400/ha higher than the next best year, the 2019 winter season. This was driven by a huge increase in growing season rainfall which saw amounts reach upwards of 430mm, a 200mm increase on the 2021 growing season rainfall. Given this amount of growing season rainfall, surprisingly, wheat yields were not the highest that we have in our database (20 years) with the 2016 winter season trumping the 2022 winter season by roughly 0.4t/ha. Average barley (4.6t/ha) and canola yields (3.0t/ha) were the highest that we have on record.
Medium Rainfall
Farms within the medium rainfall group experienced a growing season rainfall amount of 500mm which was an increase of 170mm on the 2021 growing season rainfall. The 2022 growing season rainfall was only 70mm higher than the Medium to low rainfall group.
| Many farms elected to plant more area to oilseeds than legumes, unlike the farmers in the lower rainfall groups. The amount of grain production stored for sale remained high with roughly 50% being stored for sale post-harvest. Gross crop return was $1200/ha which was down $300/ha on the previous year and down $400/ha when compared to the Medium to Low rainfall group. One of the reasons for this is that some farms experienced issues with waterlogging in potentially high value crops. Wheat and Canola yields dropped 1.0t/ha and 0.3t/ha from the previous year. | 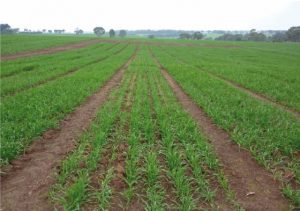 |
High Rainfall
Similar to farmers in the medium rainfall zone, the high rainfall group elected to plant a high amount of area to oilseeds (around 40% of total cropped area), with cereal area remaining steady year on year at roughly 40% of overall cropped area. Unlike the Medium and Medium to low groups, farmers elected to sell roughly 50% of their overall production. The growing season rainfall of close to 600mm on the back of good stored moisture resulted in crop returns in excess of $1600/ha. This figure was significantly down on the previous year of circa $2100/ha. The high rainfall zone delivered wheat yields of 4.5t/ha, however, yields were down on the previous 3 year average of over 5t/ha. Barley yields in 2022 at 4.5t/ha were similar to previous years while canola yields were 2.7t/ha, slightly down on the 2021 winter season.
If a report like this interests you for your farm, please get in contact with ORM on 5441 6176.
James Naughton, Graduate Business Analyst
For more information contact us here admin@orm.com.au
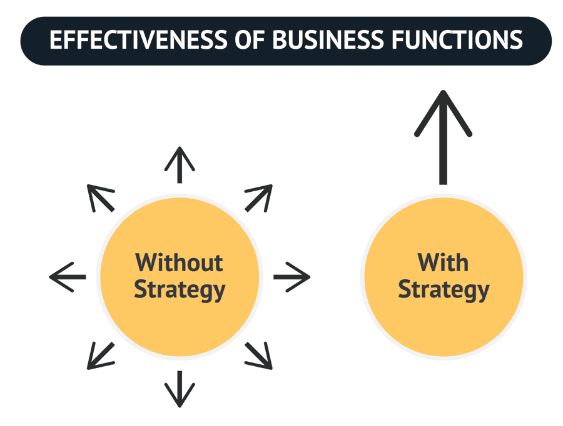
In last month’s newsletter, we wrote about purpose being your “why” and strategy being the direction or the approach you take to achieve goals.
This month we will focus on developing appropriate strategies for farming businesses. But before you start developing a strategy, it can be helpful to identify what does a good strategy look like?
Recognising good strategy
Richard Rumelt’s distinction between Good Strategy and Bad Strategy can be useful here:
“Good strategy works by focusing energy and resources on one, or a very few, pivotal objectives whose accomplishment will lead to a cascade of favourable outcomes… Bad strategy is long on goals and short on policy or action. It assumes that goals are all you need.”1
- Good Strategy/Bad Strategy” (Richard Rumelt 2011)
It should be noted there seems to be a lot of confusion between strategy and tactics, and a lot of people representing an operational plan as a strategic one. Once you are clear on what a good strategy looks like, you can begin developing one.
Strategy DevelopmentGood strategy responds to the changing competitive environment, and good strategy begins with an assessment of the starting position. Rumelt called this first phase ‘Diagnosis’ while McKinsey’s first three building blocks of strategy are called ‘Frame’, ‘Diagnose’ and ‘Forecast’2. This is where strategy is less art and more science, and good quantitative analysis can be applied to help with the diagnosis. Some tried and tested methods to help with a situational analysis are the Strengths, Weaknesses, Opportunities, Threats (SWOT) framework, and the more in-depth ‘Porter’s Five Forces model’ assists to analyse the key dynamics that shape every industry. |
 |
 |
Strategy and Farm Business
If we were to conduct a situation analysis of agriculture as an industry and consider some of the opportunities and challenges facing farm businesses, some are a little way off (eg feeding 9 billion people), some are fast approaching (eg environmental regulation and social licence to operate) and others are harder to forecast (eg impact of climate change and timelines). A lot of farm businesses we deal with are proactively responding to many of these issues, with key strategic objectives such as improving water use efficiency, reducing reliance on chemicals, introducing technological solutions to aid productivity, reducing/supplementing synthetic fertiliser etc. |
However, one current competitive advantage of a lot of family farms that can easily become a weakness, is the fact they often do not have to pay a fair rate of return to the asset owners. In fact, if we consider equity in farmland as ‘contributed capital’ by the owner, there are not many other industries where the cost of capital is so low. For individual farms, this can result in a lack of focus on returns, and raises questions as to what that means for some family farm businesses over the long term?
Much like how tariffs strengthen a country’s position in the short term but weaken their competitiveness in the longer term, this advantage of a low cost of capital for one generation can quickly become a weakness for the next. And while low rates of return may have been acceptable by successive generations of owners in the past, expectations and practices are changing, to the point where transition of assets (and the expected returns from assets) is a risk to the long-term future of some family farming businesses.
Turning a weakness into a strength
One of the key challenges we find in succession planning can be introducing that expectation that the business pays a return to new, off-farm owners. If the business is already accustomed to paying the owners a fair rate of return and this is endemic in the business, a smooth transition will be much more achievable than if a new cost is introduced to the business. And it will increase the focus on profitability, compelling businesses to become more efficient and potentially creative.
So for many businesses the succession of a business doesn’t need to be viewed as a threat, but rather an opportunity that can be responded to with good strategic planning. And like most good plans, they require foresight, attention, revisiting and time.
If you need assistance with strategic planning, please get in contact with ORM on 5441 6176.
Ben Hogan, Agribusiness Consultant.
For more information contact us here admin@orm.com.au
Now the headers have been put away for the year and the results are in the bin, hopefully all growers have an opportunity to recharge and refresh before sowing preparation starts and we go around again. With a clear head, and equipped with production and financial results, it is also the opportune time to create a strategic plan.
Why is strategy important?
ORM conducted a Business Planning workshop last year on behalf of the GRDC, and of the four modules on different areas of running a farm business that we covered, participants seemed most surprised by the strategy and business planning module. The strategy session also rated as the session where their understanding improved the most. Through the feedback, participants highlighted that it is an area that is important to the overall success of the business, and one that gets the least attention.
Our participants are not Robinson Crusoe in this respect. In 2019 PwC’s Strategy& conducted a survey of more than 6,000 executives from companies of various sizes, geographies, and industries finding:
- Companies that get strategy right “are three times as likely to report above-average growth as incoherent companies”, and
- “35% of executives believe their strategy is going to lead their company to success.”1
So, if most executives agree strategy is important but most businesses are doing it poorly, where are we falling down?
1. https://www.strategyand.pwc.com/gx/en/unique-solutions/cds/the-strategy-crisis.pdf
Formulating a good strategy shouldn’t be complicatedWhen it comes to formulating a strategy, having a good process is important. Part art and part science, strategy formulation is often debated and there is no single correct method. There are literally libraries worth of books on the topic of strategy and it can quickly get confusing. Goals, objectives, tactics. Mission, vision, purpose, values. With so many components and differing approaches, where do we start? Diagram Source: https://consulterce.com/business-strategy/ |
 |
 |
Purpose-led strategy is the soup-du-jour of strategy consultants. And with good reason; a purpose-led strategy has famously underpinned some of the world’s most successful companies like Apple, Nike, Tesla, Amazon etc. Simon Sinek, who has sold a million copies of “Start With Why” and whose TEDx Talk on the same topic has garnered around 10 million views, describes “Why is your purpose; How is your process”, and maintains “People don’t buy what you do; they buy why you do it.”2
2.“Start with Why: How Great Leaders Inspire Everyone to Take Action”, Simon Sinek, 2009
|
Diagram Source: https://www.smartinsights.com/digital-marketing-strategy/online-value-proposition/start-with-why-creating-a-value-proposition-with-the-golden-circle-model/
Find Your Purpose
But firstly, what is purpose? One definition of purpose, as it relates to an organisation, is:
“Purpose is an organisation’s reason for existing beyond just the financial. It sets out why the organisation matters, building on its core, differentiating capabilities, and articulates the value of the organisation to wider societal stakeholders.”3
https://www.pwc.co.uk/services/consulting/purpose-led-business.html
Our presenter at the Business Planning workshop, Geoff Martin from MBS, had a simple and effective process to define your purpose:
- List your business stakeholders, and give each stakeholder an importance score.
- List what you want to be known for by each stakeholder.
- List your most important stakeholder/s and how you want to be known to that stakeholder/s. This is your purpose; why your organisation exists.
Although simple in theory, it did require plenty of thinking and created a lot of discussion amongst workshop participants. We can find examples of large public companies to see how they define purpose.
For example, let’s look at Nike’s purpose:
“Our purpose is to unite the world through sport to create a healthy planet, active communities, and an equal playing field for all.”4
“Communities”, “the planet” and “all” can be viewed as Nike’s most important stakeholders; creating “active communities”, “a healthy planet” and “an equal playing field” is what Nike wants to be known for by each stakeholder respectively; and they are going to achieve this by “uniting the world through sport”.
Now most organisations don’t have the reach or the lofty ambitions that Nike do, but it also could be argued that those daring ambitions are what has driven the company to get to where it is now. And while we described purpose as being beyond the financial, it is also the way a business produces profit. So purpose and profit are not mutually exclusive.
4. FY19 NIKE, INC. Impact Report Executive Summary
How does strategy fit with purpose?
Once purpose, or the “why” is defined, strategic objectives will be the “how” you deliver on what you will be known for, bringing the purpose to life.
So, if a goal is an outcome or a desired result; a strategy is the direction or approach you take to achieve it, while a plan is the details.
Look out for more on strategy in next month’s newsletter, or if you would like help with strategic planning please get in touch with ORM on 5441 6176.
Ben Hogan, Agribusiness Consultant.
For more information contact us here admin@orm.com.au
‘Only one in 10 workplaces are farms, yet they account for one quarter of all work-related deaths’ (Better Health, 2022).
ORM in partnership with Birchip Cropping Group (BCG), will be initiating a ground-breaking Victorian first Agriculture Safety Learning network in 2023.
The role of ORM and BCG
ORM and BCG will use their professional links to offer growers the opportunity to participate in a free network. Providing a platform for sharing knowledge, ideas and helping to make real on-farm changes.
Participants in the S3F network will collaborate with each other and receive support from industry specialists. The focus will be to tackle some of the critical health and safety issues experienced by participants in the program. BCG members are being invited to engage in this grower-to-grower network by registering an Expression of Interest.
Benefits of participating in the network
| Participation in the network will provide benefits such as reducing the stress and anxiety associated with managing safety, in addition to reassuring employees that safety is prioritised. The network will pilot safety interventions specifically for broadacre cropping and mixed farming enterprises around the yearly production activities.
ORM and BCG are not safety regulators; the purpose of the network will be to accelerate the adoption of improved work health safety practices on farms across the region through a community-led approach to create Safer Farms, Families and Futures (S3F). |
 |
What’s involved
A series of five face-to-face events will be conducted between March 2023 to August 2024. These events will provide the support and resources required by participants to initiate practical improvements on their farm. The network is free to participate.
Participants will be asked to commit to the program for its duration which requires representation by each farming business at the five face-to-face events. The events will take multiple formats including but not limited to farm visits, peer-to-peer activities, and training and development sessions delivered by industry experts.
Scheduled dates for the events are currently:
Event 1 – Friday 31st March 2023
Event 2 – Friday 23rd June 2023
Event 3 – Friday 22nd September 2023
Event 4 – 2024 date TBC
Event 5 – 2024 date TBC
If the S3F network is something you are interested click here for further information or feel free to register your Expression of Interest.
The motivation to develop an Agriculture Safety Learning Network
ORM Senior Agribusiness Consultant Jane Foster said the aim of the network is to see a greater uptake of improved safety practices.
“We believe that the most important legacy we can all leave to future generations of farmers and their families, is a safer workplace,” Jane said. “The safety learning network supports us to lead a community-based approach to tackling the workplace safety challenges that exist on farms.”
 |
ORM clients interested in further information can contact Jane Foster direct on 0438 416 176
The project is made possible through funding provided by WorkSafe Victoria.

References:
Better Health 2022, Farm Safety – Risks and Hazards, viewed 1st December 2022.
Jane Foster, Agribusiness Consultant.
For more information contact us here admin@orm.com.au
As harvest income becomes more certain we can start planning expenditures for 2023. Input costs are forecast to remain high and interest rates are rising, but after some careful budgeting there’s likely to be income left for discretionary spending. The following are things to consider when budgeting cashflow in 2023.
Financial Buffers as Cashflow
- Retaining some harvest funds in your trading account can create a cashflow buffer for next year (i.e. peak balance vs overdraft limit).
- Deferred term arrangements for input costs often incur a higher interest rate than bank overdrafts. Allocating some harvest funds to clear deferred arrangements and avoiding them next year can be beneficial.
- Debt repayment on term loans.
Possible benefits: lower interest costs, more flexibility with next year’s expenses, stronger equity.
Machinery Capital Purchases
- What is next on your 5 Year Replacement Schedule? Look at your major items and schedule replacement dates according to expected working life / replacement costs.
- Will the machinery upgrade improve productivity and/or efficiency?
- Will the upgrade make life easier, improve job satisfaction and workplace safety?
- Aim for an average of 10% of your farm income being spent on machinery capital and the principal portion of your machinery finance repayments.
Possible benefits: keep machinery current, production efficiency, lower repair costs (hopefully) and a happier and safer workplace.
Improvements
- Increase on-farm storage for harvest logistics and marketing
- Improve fencing and roads for all-weather access.
- Better working environment – upgrade shearing shed / workshop.
- Investment into soil health (gypsum, lime) or land sustainability (trees, erosion control).
Possible benefits: improve marketing opportunities, safety, happy workplace, environmental impact.
People
- House renovations, car upgrades, holidays.
- Fund a new employee.
- Employee bonuses, wage increases – what do we need to do to retain good workers?

Tax Planning
- Meet with your Accountant early in the year to understand your taxable income estimates.
- If it’s going to be a strong profit year, consider putting some cash into FMDs as a financial buffer.
- Make concessional contributions into Superannuation.
Possible benefits: financial buffers, retirement planning, assist with tax management.
Succession & Estate Planning
- Build off-farm investments.
- Early-payments to off-farm children as early inheritance to assist them when they need it.
- Transition some of the business or assets to the on-farm children

Next Step
Wise allocation of the profits in good years helps the business become stronger and more resilient in the future.
If harvest pressure is causing your stress bucket to be full, wait until you’re back in the Ideal Zone and talk it through with family or your advisor to ensure you’re meeting long-term goals and optimising potential for the coming year.
ORM can assist with budgeting and business planning. Good planning helps when reviewing options for the current year and assessing which will have the biggest impact on your business’s profitability and well-being.
Michele Potter, Finance Manager.
For more information contact us here admin@orm.com.au
Last year both wheat and canola prices rallied into mid-December, until large quantities of commodities came online, and likely those early shipping slots were covered. Once supply chains were full, bids reduced, until the conflict in the Ukraine escalated and caused prices to reach and exceed those mid-December highs.
This year we have a similar situation of a delayed harvest, quality declining and wheat (APW and above) and canola prices at, or around, the highs for the year. Protein spreads are increasing, with APW wheat currently trading at $75 over ASW1, $140 over SFW1 and $160 over FED1.
As the crop has started coming off, ORM asked the experts for their assessment on price outlook.
Nick Carracher, CEO and Commodity Advisor for Lachstock Consulting
| Locally – We have a massive crop coming at us and we are dealing with a lot of lower quality grain. Two distinct price outlooks for wheat: APW and above, and ASW and below. We are awash with lower quality grain and our clients’ have been busy selling large quantities but holding onto quality, as the protein spread is likely to get even bigger than current levels.
Fusarium is a big issue this year with no segregation for the affected grain and no export bid. This will impact the whole of NSW and QLD, with potential to impact Vic and SA. Piggeries took a lot of this grain last year, but there is no plan B for Fusarium affected grain. International freight costs are coming down, but that hasn’t been the bottle neck; getting the product to port has been the issue. Interior demurrage in WA is train driven, not boat driven. |
 |
Internationally – It is impossible to predict what will happen with prices in the midst of a war in the Ukraine. US Hard Red Winter wheat conditions are poor. It feels like we are ignoring gaps in grain flows.
Canola is at too big of a discount to global values, which indicates possible price upside. Russia export corridor is off, which is impacting canola pricing. There is a low oilseed area in the Ukraine, which suggests supply headwinds later. There is however a narrower window for pricing canola in Australia, as exporters are mostly done accumulating supply by the end of May.
The barley carry-in is mostly of lower quality; like wheat, there is more chance for Bar1 price to improve than the lower grades.
Recently South Australia has been the best paying market as their ports have been the easiest for exporters to execute grain shipments out of. However, currently there is a lot of grain in SA for the export path and grain probably flows the other way because the export capacity now is in NSW.
Jess Kirkpatrick, Grain Merchant, CHS Broadbent
 |
|
What’s similar to last year? Above average national production and high prices against historical averages for growers to take advantage of. For the third year in a row, La Nina is causing challenging conditions near the end of the growing season on the East Coast, so there are a few unknowns as we head into harvest and beyond. |
In general, it is thought that the flood damage will disproportionately impact individual growers and with the softer finish to the growing season combined with high cost of fertiliser reducing inputs, it is likely our wheat crop is going to be lower protein.
Exporters will be trying to maximise tonnage like last year, where 27mmt of wheat was shipped out of the country. Like quality, supply chain impacts are hard to predict now, however there could be damage to road and rail infrastructure from recent rainfall.
What’s different?
War lends itself to volatility across markets and commodities are not shielded from this. Russia invaded Ukraine in late February causing concerns about supply of grain and inputs to the globe. Many of the rises and falls in the market over the 10 months can be linked to the developments in this conflict and there will be continued uncertainty as the war continues. Simultaneously, stocks are rebuilding, particularly in Russia, and the question will be when this grain will find its way into export channels?
ORM Summary
Current protein and quality spreads are forecast to continue into harvest. Price premiums provide incentive for getting crops into the bin as soon as they are harvestable. Plan harvest to allow for the ongoing forecast wet. The cost of extra headers or in paddock logistics for grain movements may provide an excellent return on investment if avoiding quality downgrading or grain loss.
Ben Hogan, Agribusiness Consultant.
For more information contact us here admin@orm.com.au
With harvest almost upon us, it is worth taking a little time to pre-empt and prepare mentally for what will be an intense and hectic period for your business. One of the things to ask yourself is – who will be the point of control for making the required business decisions over the next couple of months?
If this is a little hazy then sitting down and writing out a simple roles and responsibilities table with a primary and secondary decision maker and sharing that with your team may help (see below).
Decision-making styles differ dramatically and the ability to make the best decision at the right time is the main differentiating attribute of the top 20% of profitable farmers.
A sound decision is an informed decision and to make an informed decision you need to be in the right frame of mind. Consider this against the backdrop of a very challenging harvest period with delays, adverse weather conditions, and complex decisions. This is where there is potential for the intensity and fatigue from workloads at harvest can impact decision-making as the decision-makers become tired, stressed, or overwhelmed.
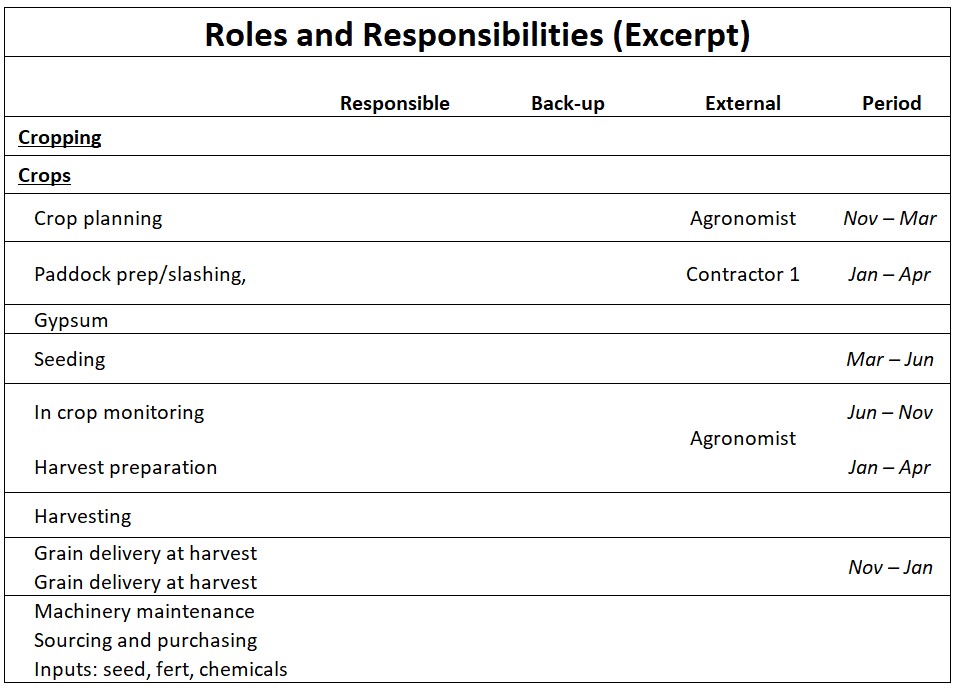
Figure 1. Part of an example farm roles and responsibilities table (ORM 2022)
So before delving into any big decisions over harvest ask yourself the following questions:
- Am I the right person to be making this decision alone?
- Should I involve someone else (eg; son, daughter, wife, adviser)
- Is there someone I should delegate this decision to completely?
The next question to ask yourself is ‘Am I in the right frame of mind to make this decision right now?’
There are a couple of ways to assess what frame of mind you are in.
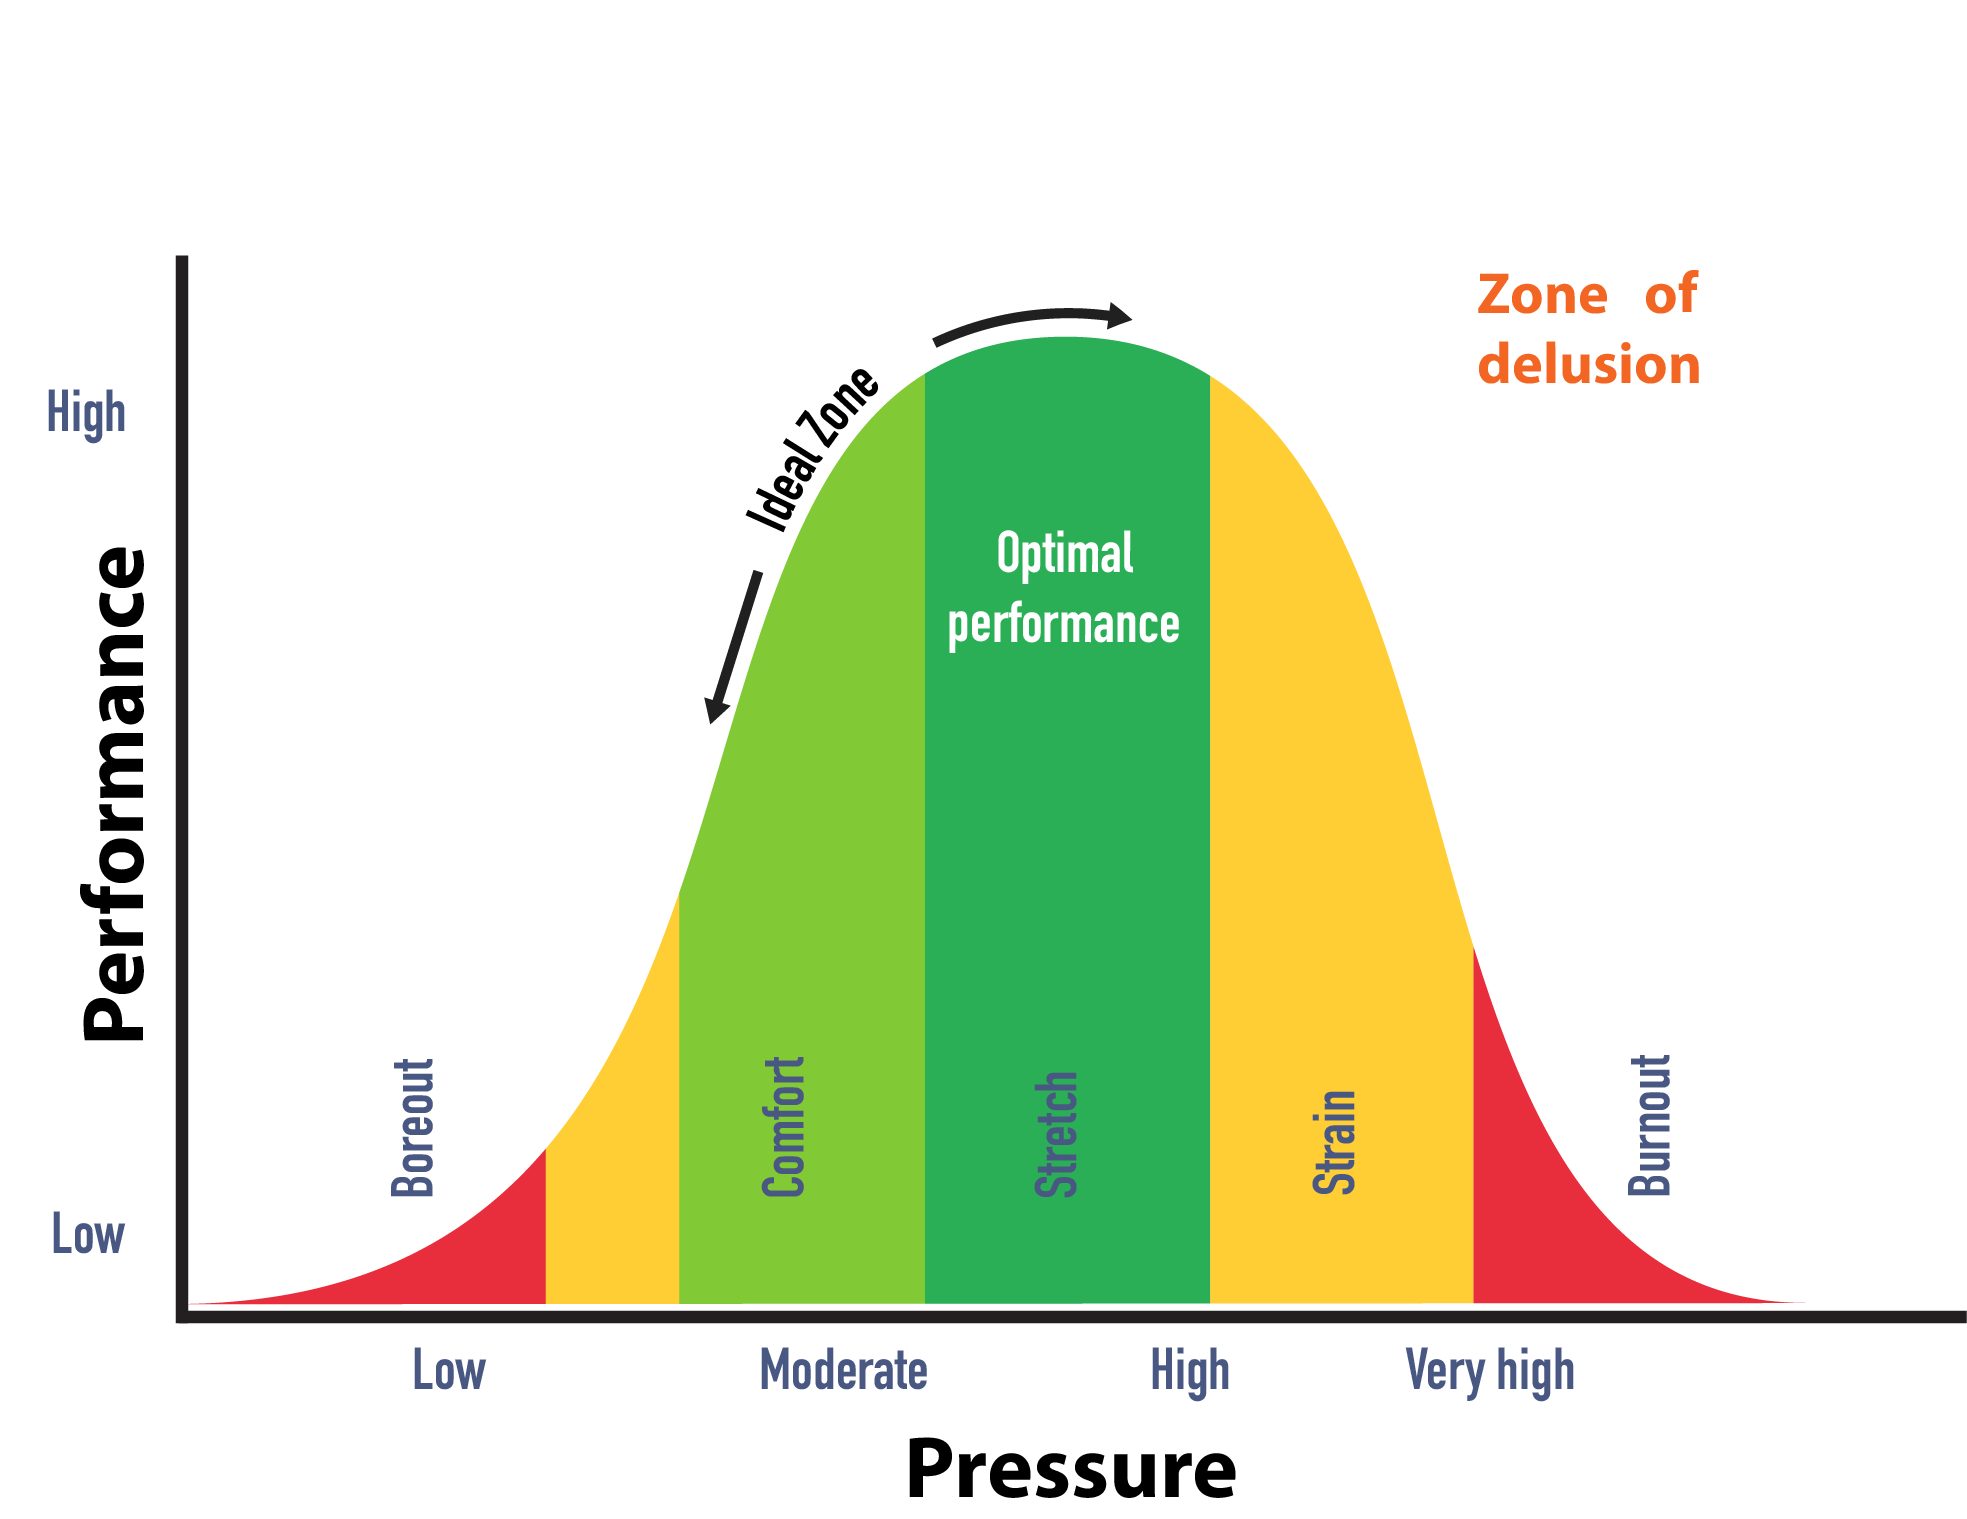
Figure 2 below shows a pressure performance curve. You need to assess whether you are in the ‘ideal zone’ or the ‘zone of delusion’.
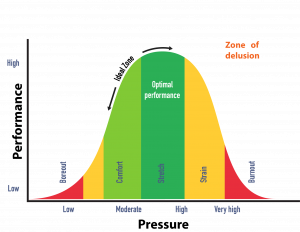
Figure 2. The pressure/performance curve (DELPIS 2022)
Experiencing a bit of stress or pressure can actually be quite helpful, as it can motivate us to get things done. However, if we are under sustained high pressure, our performance can start to decline and so does our ability to think clearly and make good decisions. If you are in the middle of harvest, you are most likely in the strain zone so it could pay to put off making a major decision until after harvest, if that is possible.
Another image that can be used to help you assess your frame of mind is the stress bucket shown in Figure 3.
The question to ask is: How full is my stress bucket?
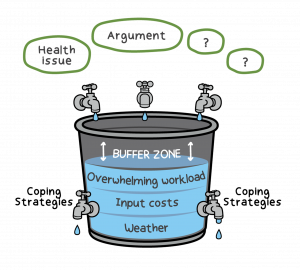
Figure 3. The stress bucket (Gunn 2022).
Of course, it is unrealistic to hope to have no stress in our stress bucket. There are always things that we need to do. What we aim to do is to have a bit of a buffer zone so that if a big decision needs to be made we’ve got the capacity to deal with it effectively, without becoming distressed.
To maintain that buffer zone we need some healthy coping strategies to help to release our tension and stress.
Examples of some helpful coping strategies.
- Watch your diet – Cut down on those Mars bars, soft drinks, and pies.
- Limit how much alcohol you drink.
- Prioritise sleep – Remember your reaction time after 24 hours with no sleep is equivalent to a blood alcohol content of around 0.1%.
- Listen to music.
- Incorporate regular exercise into your routine.
- Keep connected with people you care about.
- Making time to do things that you enjoy.
Harvest is often a stressful time because as we get busy these coping strategies are the first thing we abandon in an effort to get the job done, (when they probably should be prioritised even more at these times).
So the message here is that over the coming harvest keep a check on your frame of mind by monitoring your stress bucket, coping strategies, and where you are on the decision performance curve. If a big decision looms and you recognise you are not in the right frame then you could delay it, delegate it or share it with others.
 |
If you are interested in learning more about strategies to cope more effectively with life’s challenges and making decisions under stress go to www.ifarmwell.com.au website created by Dr. Kate Gunn from the University of South Australia. “The website has been designed by Australian farmers to help other Australian farmers cope effectively with life’s challenges and get the most out of every day” – Dr. Kate Gunn |
Matt McCarthy, Managing Consultant
Social media can be a powerful tool to help you grow your business profile. There is a lot of fun to be had managing your social media accounts, and it can be a chance for you to create an online community. It can be a bit of science and an art, but here are five important things to remember when building a social media presence.
1. Choose the right platform for your business
| What’s your goal; farm sales or followers?
If it is to increase sales, Facebook could help quickly generate sales from already established groups on the platform. It can also be great for building your audience and connecting with your local community. |
 |
If your goal is building your brand, Instagram and Twitter may provide the better platform to highlight desirable aspects of your business.
When deciding on which platforms, you will also need to consider who your target audience is. Understanding the demographics of each social media platform is vital to the success of social media marketing.
The range of platforms is increasing all the time. There is a careful balancing act in developing a social media presence that provides value, without being consumed by a need to engage in a range of platforms that take up endless amounts of time and energy.
2. Develop your brand’s identity
 |
Your brand identity is how your business presents itself, which can be achieved by visual branding. This can consist of designs, values, and advertising. By having a strong brand identity, people will more easily form a connection with your business. For example, this could be a reputation for quality, reliability, and trust. If your account is continually posting engaging, entertaining, or educational posts, this can aid in forming your brand’s identity. |
Your followers will grow to expect a particular style of post from your brand, which can help you tell your audience about your values.
3. Being active & consistent
| Being active and consistent when it comes to posting and engaging with your audience is important. Liking or replying to comments is also crucial to building your brand, but there is a fine line between too much activity and not enough. You don’t want to be spamming for followers, but too little activity, and people may not see your posts. This is something you can experiment with and work out what works best for you. |  |
4. Know what your audience is interested in
There has been a rising trend amongst consumers wanting to know where their product has come from. Only 2.2% of Australia’s population is directly involved in agriculture, but Australia’s agricultural industry makes up ~7% of Australia’s GDP (ABARES, 2021). We have seen this increased engagement with the industry through the rise of Ag Influences on TikTok who share their daily routine and farm jobs.
When opening your farming business up to the internet you must be prepared to answer questions that may seem obvious to you or reflect on criticism you may receive. When exposing your farm business you become an educator to a community, many of whom may not have any experience of what happens on farm.
5. Keep it professional
This is your business account and should be treated as such. Keep it professional and focus on providing your audience with clear information.
 |
|
Gemma Petsinis, Graduate Agribusiness Analyst
Last month Jane Foster facilitated a GRDC Farm Business livestream discussing Wills and Powers of Attorney with Russell Robertson from O’Farrell Robertson McMahon Lawyers in Bendigo.
Wills and Powers of Attorney are a regular area of discussion with our clients and requires specialist information as it can be a daunting process. A process made a lot simpler with good advice and guidance.
The main take home message from Russell, during the livestream was ‘you can control the outcome, but you have to take action’. Before you act it’s important to understand the process and choices available to you.
What makes up your estate?
| Assets you personally owned or had interest in, less any liabilities that you owe make up your estate. This may include things such as houses, land, bank accounts, shares or super. Your Will outlines the directions you have put in place for how your estate should be dispersed after you have died. |  |
There are some assets that are dealt with outside your Wills:
Superannuation
Superannuation death benefits aren’t automatically included as part of your estate and the superannuation trustee has discretion to distribute the superannuation benefit in any combination of the following:
- Surviving spouse*
- Children
- Individual who was in an interdependent relationship with the deceased i.e. housemate, people you provided financial, domestic support or personal care to.
- Estate
*Under superannuation law a spouse is defined as de facto partners and spouses, unlike tax law only applies to current spouse.
To make a nomination about how your superannuation funds are applied after your death you need to complete a document known as a ‘Binding Death Nomination.’ These nominations can be lapsing or non-lapsing – a lapsing binding death nomination will expire every 3 years, whereas a non-lapsing nomination will be ongoing in perpetuity.
Cash within super can either be taxable or tax-free, and deciding on who receives these funds can be important.
- If paid to your spouse it’s tax free.
- If paid to a child under 18 years of age it’s tax free.
- If paid to a child over 18 years of age it’s taxed at 15%.
Most super funds also have life insurance, this pay-out will be taxed at 30% if not given to one of the tax-free recipients listed above.
What happens to property that’s jointly owned?
Properties can be owned as tenants in common or jointly and depending on which, is how the other half of the ownership will transition.
Tenants in common ownership doesn’t automatically transfer to the surviving owner but is vested in the deceased’s Will.
Joint tenants will be an automatic transfer to the surviving joint tenant outside of the will.
You can check your ownership method by looking at the land titles.
For bank accounts in joint names:
| Business Partners | Tenants in Common |
| Personal Accounts | Joint |
| Husband & Wife Partnership | Joint |
| Other Partnerships | Tenants in Common |
All the bank requires to unfreeze the account for joint bank accounts is a copy of the death certificate.
Family Trusts – If you are a beneficiary of a trust, those assets are not legally yours.
 |
If you operate a business or own land through a Family Trust, you do not personally own the assets of the trust and as such, they will not be considered as part of your estate.
A trust is operated by trustees for the benefit of the beneficiaries, but the party who really controls the trust is the person nominated as the Appointer in the trust deed. |
If you are the Appointer of a trust, then it is important to ensure that the control of the trust is considered when going through the process of making a Will.
When purchasing land, it’s important to think about where you’d like the land to go when you pass. It might be more beneficial to have land in different trusts if your wish is for them to pass onto different people.
Companies
If land is held in a company, you can leave company shares to people in your Will but again not the actual assets in the company.
Who should my executors be?
Executors are appointed to make sure the wishes in your Will are carried out so they should be competent and capable of performing the role. Russell suggests that the most likely candidates for this role are those who are the primary beneficiaries of the Will, which could include a spouse or adult children for example. It is preferable that if two people are nominated they are from separate households and they should be informed of their roles and provided reasoning behind the contents of the Will.
Power of Attorney
There are two types – financial and medical. You nominate people to make decisions on your behalf and in your best interest if you’re unable to. Financial examples could be signing bank documents if you’re unable due to injury or distance. For medical they can both refuse and consent to treatment on your behalf. A next of kin can only consent to medical treatment, not refuse treatment. It’s therefore very important to have conversations with your PoA’s in case this situation occurs, and they know what your wishes are.
| It’s never too early to start planning your estate and it’s important to include all your advisers in the discussions to ensure your plans are achievable and don’t become a burden to your loved ones. Also remember that fair and reasonable may not necessarily be equal. |  |
Rebecca Sexton, Business Consultant
We recently had the pleasure of doing some financial modelling for the GRDC Farm Business Updates in South Australia. This presentation focused on purchasing farmland at current prices and the effect on farm returns.
This has been a hot topic for the last few years in the Australian Grains Industry, as many regions continue to see a phenomenal rise in land values. This newsletter highlights the key outcomes.
What needs to be considered before purchasing?
A potential expansion needs to be viewed through strategic, operational and financial lenses to judge whether it’s a good fit for the business. The lenses should be applied in the above order. If the asset is not a strategic fit or impact the existing operations, then there is no point investigating further. So, what does a good fit look like?
- A good strategy will stop you buying a Blockbuster franchise, even if the financials currently look ok. It might include diversifying enterprises or geographies to manage risk.
- A good fit operationally will allow you to get better utilization out of existing assets and resources. It might also allow your business to accommodate the next generation into a business.
- A good financial analysis will give you the best chance of growing your profitability along with your scale.
Case Study Farm
The sections below are based on a modelled farm from ORM’s database.
Where to start?
| Begin with a financial analysis of the farm’s own historical data and costs structures to determine the current level of profitability. The chart shows the modelled farm is currently profitable, retaining 13% of total income (as net profit before tax) over the past 5 years. This demonstrates the farm has a financial buffer to absorb shocks, plus the potential to fund an expansion. |
|
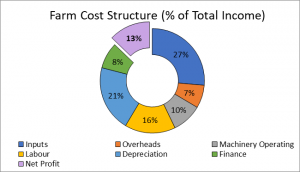
| The next step is to look at the productive capacity of land and the financial fit for the business. The table shows the model farm is looking to purchase 391 hectares, which is 15% of its’ current area. If purchasing at market value for $4,698/acre, then the total acquisition cost will be approximately $4,806,000 (after stamp duty and legal fees.) | 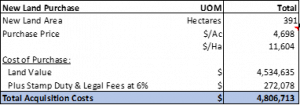 |
We can then use some assumptions to conduct a feasibility analysis on the farmland, including:
- 5-year average yields
- 5-year average commodity prices
- Interest rates
- Current cost structures, allowing for any some labour and machinery efficiencies.
The table below shows the financial performance of the farmland in isolation from the business. This demonstrates a negative return of -$36/hectare, or -$14,220 in total. This would encourage us to either reduce the price we are prepared to pay or look at a different expansion option.
Using current high commodity prices and based on average yields, the asset would generate a positive return, but we need to be conservative with assumptions.
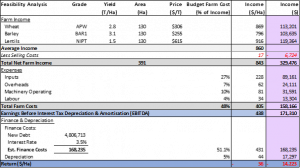
The farmland purchase can then be analysed in combination with the existing farm to calculate a whole farm return. We can see that despite increasing income, the new cost base does erode the farm’s net profit (before tax) by $14,223. This is the equivalent to:
- Reducing net profit by $17/ha or,
- Reducing overall profitability by 5.7%.
This is happening due to the increased interest expense; the expansion is 100% debt funded. Despite increasing the income, interest costs have increased from $64/ha to $112/ha, or by 5.7% of total income.
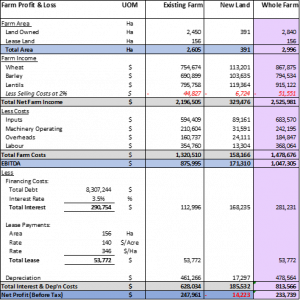
Equity & Security
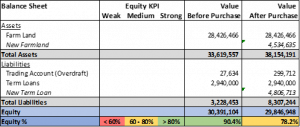 |
By purchasing another 391ha, our model farm goes from 90% to 78% equity, in the medium to strong zone. From a security perspective, lenders would likely be comfortable with the expansion.
|
How sensitive is profitability to our largest expenses?
It is also important to conduct a sensitivity analysis, particularly in the current volatile commodity price and cost environment. This will allow us to identify our biggest risks and to look at mitigation strategies.
We can see that changes to prices received for our commodities, yield or a combination of both have the biggest impact on profitability. For example:
- With a 10% increase in revenue and no increase in expenses, the NPBT more than doubles to $162/ha or $486,337
- The next biggest driver of profitability is input costs; an isolated 40% increase in inputs would make the business unprofitable at -$13/ha or -$39,689
- Interest expense is always important to consider as it can be one of the easiest expense items to control.
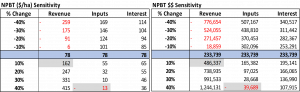
Where to from here?
Taking the time to sit down and step through the strategic, operational, and financial can be of real benefit for a farm looking to expand. A thorough analysis can:
- Give the business owner more confidence in the decision to increase scale
- Provide lenders and stakeholders more comfort and assist them with any loan application
- Highlight current areas for improvement, regardless of whether you are successful with the expansion opportunity or not.
ORM can provide financial modelling and advisory for different farm expansion opportunities to help grow your business. For more details, please contact us here admin@orm.com.au
Ben Hogan, Agribusiness Consultant
Sam Bruce, Business Consultant
Navigating the requirements for the safety of your family & employees on the farm can be daunting and time consuming. How do we create a culture of safety and put processes in place to ensure the ongoing protection of all team members?
Who is responsible?
|
Ultimately the farm owner/s and/or managers are responsible for adopting and implementing farm safety practices. Creating a safe work environment will help avoid serious injury or fatalities, it can also improve productivity on farm and increase employee satisfaction. |
 |
What are the challenges?
There are many challenges faced by managers that present obstacles to creating a safety culture on farm – it can all seem too hard!
- Multiple worksites – various locations that pose different kinds of risks make putting processes in place more difficult eg. a paddock with overhead powerlines, another with potholes
- Seasonal or inexperienced workers – sometimes workers have limited skills and weeks of training isn’t always an option during harvest!
- Supervision – managers are not able to supervise multiple work areas
- Shortage of materials – sometimes the correct tools/equipment are not on hand to solve a problem and the ‘just get it done’ attitude and using what is on hand, is the only option
Where do I get help?
 |
Navigating your farm safety requirements and putting procedures in place can feel like a time consuming and sometimes daunting prospect!
|
Creating a system that works for you, that can be easily implemented, updated and maintained, is key. You need to identify the critical risks, document them and put safe practices in place. New staff & contractors will need safety training during the induction process, some will also need on the job training in safe operation of equipment and safe work practices around the farm.
Help is available via the Australian Government Business website with clear steps on:
- Identifying hazards in your workplace – finding anything that can cause harm
- Assessing the risks – how dangerous is the risk and how to control it
- Controlling the risks – eliminating risks and finding alternative methods
- Reviewing the controls – scheduling regular inspections to avoid incidents
- Recording & reporting safety issues – keeping records and compliance
There are links on this page to assist with creating Policies, Procedures & Processes and developing a risk management plan for your business.
If technology is your preference, there are Australian digital options, specific to the agriculture industry – these tools are laptop, smart phone & tablet friendly, can be updated in real time and can digitize and centralise your compliance requirements. Protocols and tasks can be developed as needed, there are equipment maintenance records, and an HR tool and the system manages the storage and retention of safety documents and compliance activities. An example of this technology is Safe Ag Systems.
How do you create safety culture?
The most effective tools for creating a culture of safety on your farm are leadership and communication.
Strong and consistent leadership when implementing safety practices will influence attitudes & behavior of other team members. When an employee witnesses their manager or employer putting safety processes in place and adhering to these processes consistently, it makes them feel cared about and reinforces the importance of a safe work environment for everyone.
Encourage your staff to talk to you about safety and report anything they see that might cause injury. When they are included in the process, their attitude and mindset are more engaged with the safety culture which benefits the entire team.
|
Creating & maintaining a positive culture of safety on your farm comes from the top – with strong leadership and procedures in place, you will mentor your employees and lead by example. Your team will respond well when they feel cared about and listened to. |
 |
Bev Wood, Communications Consultant
For more information contact us here admin@orm.com.au
Instability in global markets is shaping up to be favorable for Australian Farmers, and it is predicted that this year will produce another record crop (Department of Agriculture, Water and the Environment, 2022). While farmers are seeing some of the highest commodity prices in years, input prices are following the same trend. During budget review meetings with ORM clients, input price increases have dominated conversations, with prices for fertiliser, chemicals, and fuel having increased up to three-fold on last year. Russia was the world’s largest exporter of fertiliser and Ukraine supplies potash and urea. Russian exports have all but ceased due to the sanctions placed upon them and Ukraine is unable to export its key fertiliser ingredients due to the conflict.
| Managing and planning for increased input prices is more important than ever. Farmers are turning to different methods of application and crop rotations to help mitigate against these high input prices. |  |
Modified crop rotations
When preparing 2022 plans with ORM clients, there has been a trend towards an increased area of legumes. Farmers and agronomists are adding in these nitrogen fixing crops to reduce the amount of nitrogen they are required to buy for this year and next. A study conducted by Chris Minehan (RMS Agricultural Consultants) concluded that including lentils in your crop rotation can increase financial returns by around 50%. This is not only due to the reduced fertiliser costs, but also the subsequent higher cereal crop yields due to the stored N in the soil being higher than a 100% cereal crop rotation.
 |
During meetings with ORM clients, we have found the businesses with the best budget surplus are the ones that are adapting their farming system to reflect the changes to the global markets. Whether taking advantage of high commodity prices or increasing the area to lower input land use options such as grain legumes and livestock, it is important that farmers are weighing up the risks associated with the current high cost of inputs. |
Precision Agriculture
Costs can be further managed using precision agriculture to reduce and redirect inputs for best production and return. Agronomist David Eksteen (The Weekly Times, 2022) suggested that soil testing and working out what nutrients your soil already holds is one way of reducing costs. Eksteen stated (The Weekly Times, 2022) that farmers might be able to reduce the amount of phosphorus applied as phosphorus builds up in the soil. By conducting soil testing it also allows growers to know precisely what amount of fertiliser they need to optimize results and reduce costs. Adrian Roles (AgTrak) spoke about his first-hand experience with precision ag at the GRDC March 2022 Farm Business Update in Bendigo. Roles suggested one way for growers to reduce their fertiliser costs is to be more efficient and effective with fertiliser application.
| Designing a variable rate program takes time and investment and is not only financially beneficial but also agronomically too. Roles confirmed that it takes time and growers have to be patient while designing a program. Roles gave anecdotal evidence of how their farm has reduced costs using this precision technology. The increase in input prices has increased the relevance of precision agriculture for the future of profitable cropping operations. | 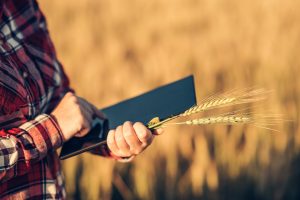 |
Take home message
Commodity prices are at record high levels, and there’s confidence for a good production season in 2022, however input costs have increased up to three-fold and can erode profits. To reduce financial risk in 2022 some businesses have modified crop rotations and are using precision agriculture to manage these high input prices. Increased risk can come from change, so it is critical that farmers reflect on how they are managing their farming system through these volatile times.
Gemma Petsinis, Graduate Agribusiness Analyst
For more information contact us here admin@orm.com.au
During the past 12 months I had the pleasure of facilitating four different mentoring relationships which were part of the AgVic Young farmer and new entrant mentoring program. The program placed a younger farmer, in the early years of their farming career, with an experienced farmer. They meet formally throughout the 12 months to discuss issues and opportunities that the mentee wanted to address. The enthusiasm of the mentees along with the willingness of the mentors to share their experiences and knowledge meant the program was hugely beneficial to all involved. The success of this program meant that we are continuing with a new bunch of excited mentees & mentors in 2022.
| This program confirmed for me that everyone should have a mentor and be a mentor during their life. But what is the purpose of mentoring? If you google mentoring, you will get an explanation that it’s a relationship between two people with the goal of professional and personal development. |  |
Through my facilitation role of this AgVic young farmer mentoring program, I have identified the key benefit for mentees is having someone to use as a sounding board. We all have ideas in our head and often struggle with that next stage of assessing if this idea has merit. By sharing the idea in a comfortable environment with someone who does not have any personal connection with yourself or your business, is a great way to test ideas. My work as an ORM consultant is similar to the mentor role, we provide the sounding board, some knowledge and data to help farming families achieve their goals both business and personal. It’s rewarding to see the satisfaction it brings people when they can work through an idea, problem, or opportunity.
Some of the key benefits from the perspective of both the mentee and mentor are listed below:
Having a mentor
- Having a sounding board for ideas
- Drawing on someone else’s experience and knowledge
- Encouragement and support for improvement
- Useful feedback on ideas and behaviour
- Extends your professional network
Being a mentor
- Reinforce your knowledge in an industry you’re passionate about
- Be challenged by someone else’s perspective and thinking
- Giving back to the industry
- Improved communication and personal skills
- Confidence building
Take home message
The benefits from being on either side of a mentoring relationship are numerous. Young farmers have the enthusiasm and willingness to have a go, while the older generation can be reinvigorated and inspired through supporting the successes of the next generation.
Tim Bateman, Agribusiness Consultant
For more information about the program please contact us:
ORM clients are certainly no stranger to hot and dry seasonal conditions. Due to 2019 being recorded as one of the driest on record, the industry is beginning to wonder exactly what climatic conditions we are likely to expect over the next 45 years. This question sparked a DELWP sponsored project with Monash University, who co-opted ORM as a key partner. The project explored the impacts of extreme temperatures on historic wheat yields in Northwest Victoria and then converted this into yield predictions under 10 climate change scenarios.
The impact of climate change on wheat yields
| The project utilized historical farm data from 37 farms for the years of 1993-2018 for the Mallee & Wimmera regions. The data was combined with climatic modelling to provide yield projections for the next 45 years based on different climatic scenarios.
Under ‘Hotter & Drier’ scenarios an increase in temperatures combined with low rainfall could have negative impacts on yield potentially resulting in long term yield decline & increased climatic variability. |
Yield Predictions under Hotter & Drier scenario
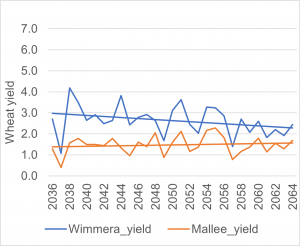
Within a ‘Warmer & Slightly Wetter’ & ‘Warmer & Wetter’ scenario wheat yields improve in both regions due to fewer freezing days, warmer temperatures as well as a higher rainfall.
Yield Predictions under Wetter and Slightly Warmer
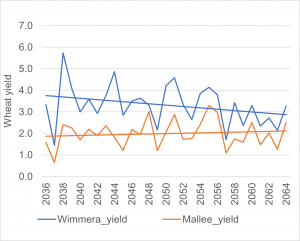
Within both the Wimmera and the Mallee regions the adverse effects of frost and heat stress on yield is either fully or partially offset by increased rainfall. The data did identify key differences between the two regions. Within the Wimmera region frost was a major factor impacting upon wheat yields whereas heat stress during grain filling posed a much larger risk to yield within the Mallee region.
These scenarios raise the important question of which one is the most likely to eventuate over the coming decades with particular emphasis on whether we are likely to see a ‘Warmer & Wetter scenario or a ‘Hotter & Drier’ scenario.
The recently released IPCC (2021) Australasia Factsheet indicates that the Hotter & Drier scenario is more likely to eventuate for the Mallee & Wimmera region. The negative impact of the ‘Hotter & Drier’ scenario will be felt more in the Mallee in comparison to the Wimmera. Yields may fall by up to 30% compared with a 11% fall in the Wimmera.
Impact of climate change on farm profitability
For farms within the Wimmera and the Mallee regions it is typical to diversify across a number of crops and enterprises. On average, farms within the Wimmera obtained around 30% of their farm income from wheat and about 20% from livestock compared to over 40% from wheat in the Mallee region.
Within the Mallee region between the years of 1993 and 2018 the share of non-wheat income has significantly increased. Farmers are diversifying revenue streams to increase farm resilience. Future economic impacts will largely be determined by farm business’s ability to continue to adapt to climatic change to maintain farm profitability.
Revenue distributions of Wimmera/Mallee farmers from 1993-2018
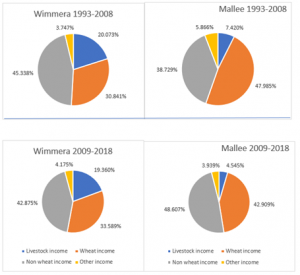
Take Home Messages
The results indicate that future wheat yields may decline under hotter and drier climatic scenarios and the level of yield volatility within Northwest Victoria is likely to increase.
History has shown that farmers within the region have demonstrated the ability to respond to changing climatic conditions and challenges. Provided that farmers continue to effectively manage both production & price risk while building more resilient farming systems there is every reason to be optimistic about the future of farming in Northwest Victoria.
Key Climate Article Contact
We hope you enjoy the bulletin and encourage you to pass it on through your networks.
For more information about the project please contact us:
Who would have foreseen the unprecedented Canola prices when we started planning for 2021? But then Canada experienced an unprecedented drought with the result that Canola yields plummeted placing significant upward pressure on prices. Recent domestic weather patterns mean APW Wheat is also rallying hard and feed wheat prices are maintaining.
For those that have been able to get through the season with crops intact and strong yield results, the income per hectare will be the best results that we have seen over the past decade. Even with average yields the strong commodity prices will see above average income.
| For farms that went early with fertiliser and chemical purchases for the 2021 season, they have ended up ahead of the curve. As 2021 progressed we saw the steady increase in fertiliser and chemical costs. Glyphosate current price at $14/L and there are challenges landing on a price for fertiliser for 2022 season. |  |
Prices are indicated above $1,200 per tonne for MAP and Urea. So, looking forward to next year, unless there is a sudden and dramatic correction in fertiliser prices, in line with the 2008 experience, we expect that input costs will be significantly higher for the 2022 crop.
For those who have committed to fertiliser contracts for next year, the prices are locked away. A lot of early buying was driven by availability and future price concerns. Others are taking a wait and see approach, willing to absorb the price closer to sowing with expectations that they will be able to source supply.
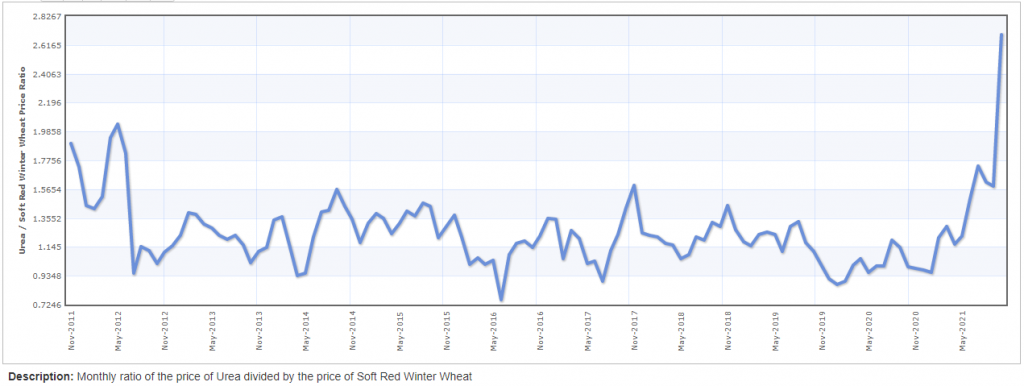
Figure 1 – Ratio of the price of Urea to the price of Soft Red Winter Wheat
Source – https://www.indexmundi.com/commodities/?commodity=urea&months=120¤cy=aud&commodity=soft-red-winter-wheat&indicator=price-ratio
The strong financial results from 2021 will provide the cash in the bank that will be needed to fund cropping costs next year. The challenge for 2022 will be if we get caught on the turnaround, high input prices in the early half of the year accompanied by softening commodity prices for new crop.
Table 1. Gross margin for a 2 Tonne per hectare canola crop decile 5 to decile 10 price
| $550 per tonne (decile 5) | $900 per tonne (decile 10) | |
| $/Ha | $/Ha | |
| Total Income | 1,100 | 1,800 |
| Crop Fertiliser | 400 | 400 |
| Chemical | 150 | 150 |
| Seed | 70 | 70 |
| Total Costs | 620 | 620 |
| Gross margin | 480 | 1,180 |
The higher fertiliser and chemical costs can be absorbed when commodity prices are strong. At current spot price a 2 t/ha canola crop could produce $1,800 of income per hectare. If canola was still at a decile 5 price of $550 per tonne, then the high input costs would be taking a considerable bite off farm profits. Gross income of $480 per hectare to cover machinery costs and labour along with overheads would not leave much free cash to provide for re-investment, debt amortisation and family needs.
 |
Preparing a budget for 2022 will provide the clearest indication of what the risks to each farm business looks like going into the new year. It will be the year for planning, analysing, and executing to actively manage the financial risks through the year. |
If hope is not a good business plan, then 2022 is not the year to leave financial outcomes to luck or fate. ORM will be working closely with clients in the lead up to sowing, to manage cashflow and financial risks throughout the year.
2021 was certainly an extraordinary year, presenting many different challenges, but as an industry Agriculture is holding strong.
From the ORM team, best wishes to everyone for a safe and Happy Christmas and New year, we look forward to continuing to support farming business in the year ahead.
As farmland prices have exploded higher over the last 12 months, there are a lot of farmers keen to understand the effect it will have on farmland lease rates. Unlike sale transactions, lease prices are not often reported or registered, so the lease market can be opaque. Also, given the length of some lease agreements, there is often a lag between property values increasing and any effect on lease prices. So what should we expect?
Farmland lease yields have declined
 |
While lease yields are reducing, along with the decline in interest rates, yields have reduced across most asset classes. The old guide of rents as 4-5% of land price are difficult to support where land values have increased so rapidly in the past 18 months. |
One large segment of lessors we deal with are retired farmers or absentee owners, often using the lease income to fund their retirement or provide investment income. While they might be keen on lease increases, debt levels are often low to non-existent, and the thinking might be if lease income increases alongside the cost of living, they are no worse off. Also, they are invested in an asset class they know intimately and that has been growing in value, so are unlikely to exit based on declining yields alone.
Corporate farms can be broadly split into owner operator and owner lease models. The latter segment of lessors might find the reducing yields more of a challenge than the retired farmer segment; their investment vehicles are often designed and marketed to provide their investors with a dividend of a certain percentage of funds under management. Recently we have seen some corporates divest of assets previously leased out, which might be less of a view on rural property prices, and more of an inability to generate operational returns required by investors going forward.
Demand for leases
| We expect demand to increase as there will be many businesses looking to expand operations but deterred from purchasing or unable to purchase due to the increased prices. Combined with recent good seasons and commodity pricing, this might put some upward pressure on lease prices, however demand is elastic; it evaporates at the point it ceases to be economically viable to lease the land and operate it at a profit. |  |
Looking at a couple of recent property sales in Western Victoria in October and estimating a yield using nearby lease prices that we are aware of, we can see that implied current yields might be well below 2%. Refer to Table 1.
We have recently seen offers from corporate landowners of 4% yields (owner to pay rates and insurance), but applying it to our recent sales, it would not likely generate a lot of interest.
Table 1: Lease rates estimated by yield 4.0%, 2.0% and 1.5%
| Sale price ($/acre) | Lease price at 4% yield ($/acre) | Lease Price at 2% yield ($/acre) | Lease Price at 1.5% yield $/acre) | |
| Ross Bridge | 13,500 | 540 | 270 | 202 |
| Marnoo | 8,000 | 320 | 160 | 120 |
How do we position ourselves in the current market?
As discussed above lease rates were often estimated as a 4% return on the land value per acre. This is no longer achievable, as seen in the table above. To make an analysis of lease costs per acre now relies more heavily on analysis of the productive capacity of the land and assessing the costs of production.
 |
A production-based metric involves evaluating the gross margin with allocation of an acceptable proportion as payment of the lease. Historically this has approximated 50% of the crop net income after input expenses and machinery operating costs. |
To undertake this exercise assumptions are required to be made about the achievable yields and market prices, along with the costs of inputs.
Table 2 – Crop net income (exc overheads) analysis of lease rate
|
$/HA |
$/Acre |
|
| Total Income | $780 | $315 |
| less Costs of production exc overheads | $400 | $162 |
| equals Gross Profit | $300 | $153 |
| 50% share to lessor | $150 | $77 |
A business operator may elect to exclude machinery operations costs and absorb this to enhance their probability of being successful in obtaining the lease and achieving other benefits. Table 3 demonstrates the variance in lease rates between the two approaches.
Table 3 – Crop gross income analysis of lease rate
| $/HA | $/Acre | |
| Total Income | $780 | $315 |
| less Costs of production exc overheads & machinery operating costs | $211 | $85 |
| equals adjusted Gross Profit | $569 | $230 |
| 50% share to lessor | $284 | $115 |
Sharing the risk?
| We also expect more interest in sharefarming options from landowners looking to improve lease yields, which involves the landowners participating in some of the production and price risk.
Over the years we have seen many methods of calculating a profit-sharing arrangement. The percentage splits will differ in different production areas (along with associated production risk), but simply put, the greater the share of costs the greater the share of income. For any agreement to work, it is of critical importance that both parties understand the implications of what they are signing up to, and to have everything detailed in the agreement from the outset. If structured correctly it can provide a real win/win for both parties. The lessee lessons their risk, the owner participates in more upside in the good years |
 |
If you would like help exploring lease options and the alternatives, ORM can assist with analysing the financial outcomes and developing a range of options – Contact Us
At the start of 2021, urea was around $400/t and MAP was around $800/t. Since then, prices have risen to levels around $800/t and $1,000/t respectively. Fertiliser costs historically make up 12-15% of average gross farm income. ORM modelling shows that if fertiliser prices remain at current levels throughout 2022, with no change to the rate of fertiliser applied, then fertilizer cost increases to 20% of average gross farm income. If all else remains the same, this increase in fertilizer price will result in a 70% reduction in farm profit.
 |
This is not the first-time growers have experienced such a price increase. During 2008, when prices last increased over $1000/t for phosphate fertilisers, many growers responded by reducing the rate of phosphate fertiliser applied, to match their budget. Concerned about the effect on farm profitability, consultants and farming groups also started looking for tools and farming practices that could lead to improved efficiency of fertiliser application. |
The fertiliser “bank”
It was estimated by CSIRO in 1997 that each hectare of soil in our broadacre cropping zones contained up to 400kg of phosphorus, or roughly equivalent to 1600 kg of MAP. The high levels of phosphorus in the soil are the result of the addition of phosphate fertiliser nearly every year for the past 100 years. Initially, when farmers began growing crops, the native soils were extremely low in natural phosphorus, very often less than 10kg/ha. When farmers started growing crops through the late 1800’s, yields were over 1 t/ha, however as the phosphorus depleted in the soil, the yields dropped to less than 500kg/ha at the turn of the century. With the advent of easily accessible fertiliser, and other improved farming techniques, yields have improved 4-10 times this level (2-5t/ha).
| Although there are improved fertiliser products now, the efficiency of fertiliser is still only around 20%, i.e., if a grower applies 50kg/ha of MAP or around 10 units of P, then only 2 units of P from the applied fertiliser is used in the current production year. The other 8 units of P are ‘locked up’ in the soil in various forms, with up to half being locked-up in tightly held chemical bonds long-term in the soil, hence the increase from 10 to 400 kg/ha of P. With levels increasing with every year that phosphorus is applied, the question should be asked, ‘Is there a way of unlocking this soil P bank?’. | 
|
Unlocking the bank; Science, or snake oil?
Some proponents will tell you there are products capable of increasing the efficiency of fertiliser and ‘unlocking’ this ‘P bank’. Many of these marketed products have not been field tested widely enough to show economic benefits, but the story is certainly compelling enough to warrant further investigation.
 |
The industry gold standard for field testing products is replicated, randomised, statistically analysed trials using a standard protocol with known controls. Many products fit the category of the ‘silver standard’ i.e., grower paddock comparisons, with the ‘bronze standard’ being laboratory pot trials. |
There are a few fertiliser efficiency products (phosphate solubilising fungal products) available in Australia that can claim to meet the ‘gold standard’ of testing; one was discovered by CSIRO and the other by Agriculture Canada. These products have been widely field tested in wheat, canola and legume crops in Australia using industry best practice field testing procedures. Claims are of yield improvements in the vicinity of 5%, cost of around $20/ha and the reduction in fertiliser P applied of up to 50%.
| Even though these products have been field tested by companies, it is still advisable that growers also field test these products to confirm the results before widely adopting them. Growers should be wary of using products that do not undergo ‘gold standard’ testing as these products could potentially add cost without contributing to income, and if phosphate fertiliser rates are reduced using these silver and bronze standard products, then yields could fall over a period of 4-6 years.
|
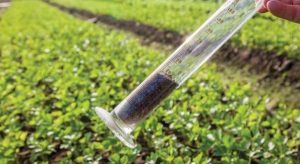 |
Combined small changes in farming practice can offset the increased fertiliser prices
 |
If growers combine several small changes (the ‘one percenters’) into their farming practices such as soil testing, variable rate application, utilising ‘gold standard’ fertiliser efficiency tools and better performing seed varieties, much of the higher price of fertilisers could be off-set. And even if fertiliser prices fall from current levels, changes made in response to the high prices will make your business more profitable in the long-term and far more resilient to future shocks. |
If you would like more information, contact ORM – Contact Us
Combining eighteen months of generally good feed-growing conditions with a reduction in export demand has seen some ‘headwinds’ for oaten hay prices of late.
When we calculate gross margins for several Wimmera crop options this year and use $150/t as the farmgate price for oaten hay, we see that hay is indeed our lowest returner at $245/ha.
| Oaten hay returns look particularly paltry when compared to the historically good pricing levels on offer for cereals, canola and pulses. If we assume that there are another $200-$300/ha of fixed costs to come off the gross margin figure, on the face of it, oaten hay could very well be a loss maker this year. | 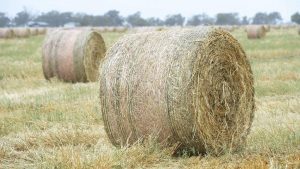 |
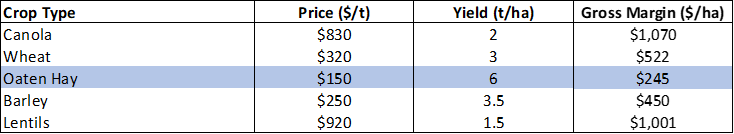
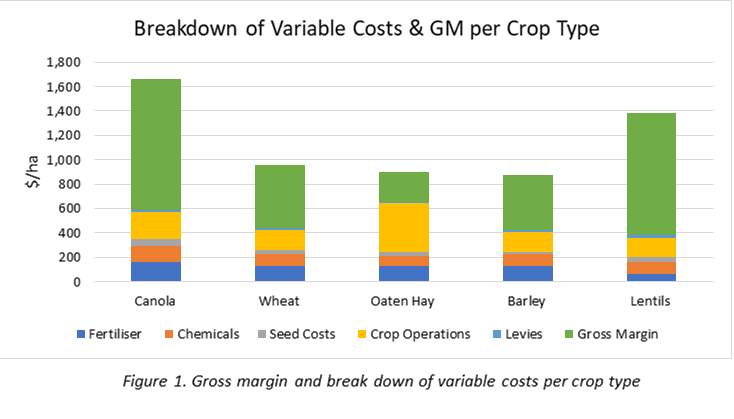
 |
However, when assessing the value of oaten hay in the rotation, we found it misleading to look at the single season result alone. Not only does it pay too much attention to short-lived commodity price cycles, that are often not capitalised on, it does not account for the other benefits of having oaten hay in your rotation. We have tried to put a dollar figure on some of the benefits to provide a fairer comparison. |
Hay in the rotation provides a very effective non-herbicide mechanism of weed control. Without it, growers often need to rely on alternate forms of weed control like weed seed destruction at harvest or running livestock. While very dependent on individual farm or paddock weed problems, recently ORM has completed analysis that showed average gross margins increased by up to $110/ha per annum with optimum weed control over a 15-year period.
With hay being cut in September, the extra soil moisture that can be stored could have up to 0.5t/ha yield benefit to the following season’s cereal crop. At $320/t for wheat, that equates to an extra $160/ha.
| If we consider these weed management and moisture benefits alone, we can add up to $250/ha back into the gross margin calculation which puts oaten hay returns similar to wheat and barley this year – even in this poor pricing environment. | 
|
Other benefits that exist but are highly variable (so we have excluded from gross margin calculation) include the risk management benefits hay can bring by reducing exposure to a frost or a dry spring, or the better utilisation of resources with peak production occurring outside of harvest.
Gross margins are an important tool when calculating farm profitability, but it is equally important to understand the profitability at a farming system level. If you would like more information, contact ORM – Contact Us
When committing to buying or upgrading a truck, growers should consider the initial capital invested in the truck versus the revenue earned and the labour requirement for operating the truck.
| ORM farm data and benchmarks indicate that for a consolidated grain farm in the Wimmera-Mallee, total value of plant and machinery should approximate the gross annual income for a business averaged over a 5-year period. Another ORM 5-year benchmark, derived from actual farm data, shows that growers should be investing 10-12% of gross income each year on machinery capital purchases. ORM recommends that growers consider these benchmarks carefully when making major capital purchases such as buying a truck. | 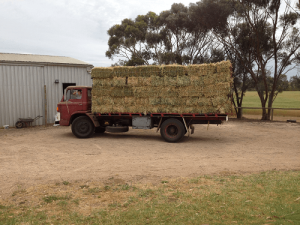 |
When buying or upgrading a truck growers need to consider factors such as what type of truck they wish to purchase, the capital cost, the purpose of owning the truck and its utilisation, the tonnes and distance travelled per year and the cost of labour in operating the truck.
 |
The truck can generate extra farm income as freight. This income can cover additional labour on-farm. The freight income is often built into the delivered price hence not clearly identified in the cashbook, so some estimates of truck revenue are needed when assessing the trucks economic return. |
The table below illustrates the type of analysis required before buying a truck. The table compares three different levels of investment in trucks: $200,000, $450,000 and $700,000. The $200,000 investment represents a second-hand truck and trailer whereas the $700,000 investment represents a new truck and trailers. The analysis assumes the truck and trailers are financed at 3.5% over 5 years and are sold after 5 years. The annual depreciation rate is calculated as the purchase price less the selling price divided by the 5-year investment period. It is assumed that the charge-out rates are $5.20 per kilometre.
Table 1. Comparing different levels of capital investment at the point of breakdown
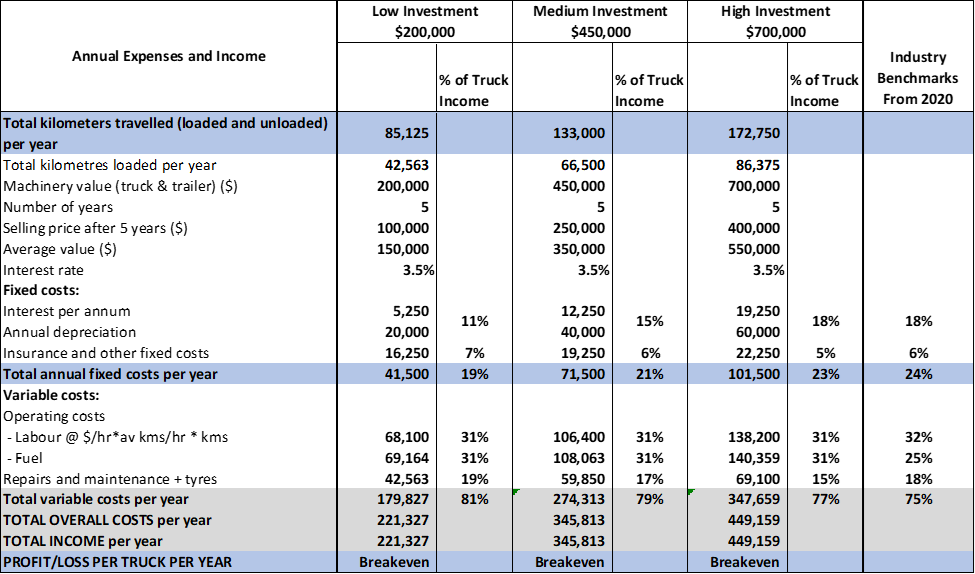
Assumptions:
Truck load = 44t
The per kilometre rate = $5.20/km
| If purchasing a second hand $200,000 truck and trailer combination, the total kilometres travelled to get the breakeven point is 42,563km of loaded kilometres. If we assume 44 tonnes per load and 300km to the port this equates to 6,242 tonnes.
If the farm purchases a $450,000 truck and trailer combination, the truck needs to travel 133,000kms, or 66,500km of loaded kilometres, to breakeven. If the farm intends the truck for own use, then 9,750 tonnes covers costs, i.e., is the breakeven tonnage. |

|
If the farm purchases a new truck and trailer combination for $700,000, the truck will need to travel 172,750km, or 86,375km loaded kilometres. If the farm wants the truck to ‘pay for itself’ i.e., breakeven the 86,375km of loaded kilometres is equivalent to transporting 12,700t at average 300 loaded kilometres. If this is more than the farm produces, then the farm might consider backloads and some commercial work to help cover costs. Labour is another issue when considering this high value new truck. If it is assumed that a round trip to the port is 600km, and the truck works 5 days a week at 1 load per day then 156,000km is travelled in a year (52 weeks), however for the truck to breakeven it needs to travel 172,750km! These extra kilometres can be covered by the backloads or may require an extra driver in two shifts to cover the extra 16,750km for a 6-week period! Another consideration is the downtime for servicing, new wheels, breakdowns etc.
The extra labour required for the two higher investment options for the trucks to reach breakeven is a consideration, especially when the truckdriver is needed on farm over the peak seasonal times. Another consideration is the question of whether the higher investment trucks lead to over-capitalisation on the farm, as ORM suggests, for a consolidated grain farm in the Wimmera-Mallee the total value of plant and machinery should approximate the gross annual income for a business averaged over a 5-year period. For example, for a 4,000ha farm with average crop yields the average gross income is approximately $2.4 million, therefore the total value of plant and machinery, including header, seeder, tractor, sprayer, bins etc. should be around $2.4 million.
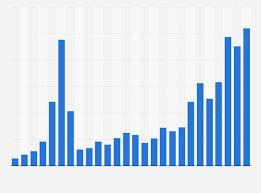 |
Matching capital investment to farm scale is the key. A farm intending to shift 6,000 tonne of grain and average 300 loaded kilometres per load, and do 300 tonnes of backloads can breakeven with an investment of around $300,000. |
There are many non-financial advantages to owning a truck when operating a farming business, including the flexibility in delivering commodities like wheat to end user customers, picking up your own fertilisers from port, improving harvest logistics or for more effective utilisation of labour in off-peak times of the year.
If you’d like to check your machinery investment guidelines contact ORM for assistance on how to calculate these.
Contact ORM for more information – Contact Us
Your typical family farming operation of today isn’t what it was 20 years ago. There have been significant advances and evolution in farming systems, technology and agronomic understanding over this timeframe. These changes and industry innovations have supported productivity growth but also made managing and operating a farming business more challenging and complex.
Being a farm business manager requires decision making which involves the following areas of expertise:
|
 |
Some of these areas will require the advice of professionals from outside the business to support management. A key trait of a high performing farm business manager is they seek out advice to share the burden of running an ever growing, complex business and making timely and efficient decisions.
 |
Feeling overwhelmed can cause stress and if left unchecked can affect your bottom line but more importantly, could affect your mental health!
When people start second-guessing themselves, they tend to become inefficient and get a sense that they will forever be pushing uphill instead of skiing down! |
Why have an advisory board?
One of the key purposes of installing an advisory board into your business management framework is to provide additional independent expertise and guidance in the strategic management of the farm business.
| Advisory boards aim to keep the business accountable to itself and will help monitor and measure key decisions and actions that have been put in place. Advisory boards assist with implementing business objectives in a systematic way and are responsible for monitoring the milestones of planned projects. |  |
The board will give you the ability to reduce the emotion in the decision-making process through accessing guidance and knowledge from a group of trusted advisers. These could include your farm business adviser, accountant, agronomist, grain marketer, banker and vested stakeholders (family members) who all will have critical input over the season.
ORM provides the independent chairperson and executive support role for several advisory boards. The boards should meet at a regular interval, at least every quarter is recommended, plus one additional annual review meeting. In the case of larger businesses or those with highly diversified enterprises, monthly meetings are recommended as the business environment can change rapidly.
Operational, tactical & strategic planning?
 |
From the outset you will outline your shared objectives for the farm business with the advisory board, ultimately; how you hope to envision the structure and prosperity of your business in the future. |
Short term planning: Will focus on utilising operational and tactical decision types, related to week-to-week activities all the way through to overall annual/seasonal planning and decision making.
Medium term planning: Will focus more on tactical and some strategic decisions and actions, normally derived and actioned by the key decision makers of the business. The main farm manager will have a major input into this section and will appreciate the outside help provided by the advisory board when deadlines are close.
Long-term planning: This is where an advisory board structure is very beneficial. The three to five year outlook may require many different contributors to help shape and achieve the vision and goals that can seem intangible and beyond your current horizon. All of these contributors having input at the same time, can provide a very methodical and efficient approach when outlining and setting goals and objectives.
Figure 1 shows the role of the advisory board is generally to make strategic direction and decisions through the input of owners, advisers and other growers or businesses.
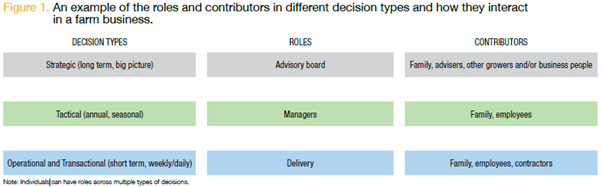
Contact ORM to discuss the potential relevance and purpose of an advisory board in your business.
Hopefully our parents will live long, happy, healthy lives, but if they need extra care in their later years how does that work for farming families?
Understanding what costs to expect and how farm assets impact on government benefits can help farming families plan and take some of the stress out of starting the conversation with our loved one.
What is the plan for your farm?Many farming families have a rough succession / retirement / estate strategy in mind, however it works best when plans are verbalised and discussed between generations. A clear understanding of what the older generation want to do allows everyone to plan towards this, and potentially access government benefits such as subsidised aged care home fees. |
 |
Some aged care benefits are means-tested, with the assets being assessed including:
- Farm assets that have been transferred to the next generation. These are considered “gifts” and continue to be considered assets of the original owners for the next 5 years after the transfer.
- If one or both are the Appointor of a Family Trust then they are considered to own all assets in the trust.
- Value in superannuation, which may include farm land.
- Value of a couple’s home, although this is capped at around $172k (May-21) and excluded if one of the couple continues to live in their home.
- Any debt should offset asset values.
- Couples are considered to have half of their combined asset value each, regardless of who’s name it is in.
 |
Having an external advisor work with you can help ensure everyone’s wishes are considered, ease the discussion around transferring assets and clearly understand the impact on both generations. |
The Cost of Aged Care
Aged care costs vary enormously between homes, depending on where they are and what they provide for residents.
| Aged care fees are broken into various categories (see end of this article for further details). How they are paid will vary, depending on whether the resident has reached means and/or income test thresholds and whether you provide an up-front Accommodation Bond to the home.
The following example uses the current fee structure for an aged care home in Hopetoun, with the assumption that no government assistance is received. |
 |
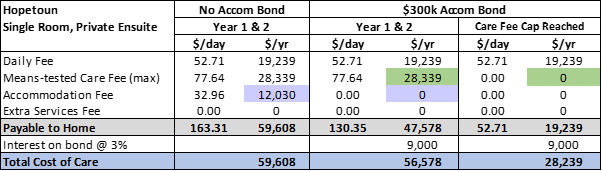
Notes:
- If no accommodation bond is paid up front, then the annual cost is currently around $60k/yr.
- If the maximum accommodation bond (set by each individual home) is paid, then the interest offsets the accommodation fee and the annual cost is around $48k/yr, and there is a slight reduction in the total cost.
- The means-tested care fee has both an annual and lifetime cap set by the government. The current cap is $28,338.71/ year and $68,012.98/lifetime. Once these caps are reached the individual does not pay any further Care Fees.
- Each home must publish their maximum accommodation costs on the My Aged Care website, however there may be scope to negotiate a lower price with individual homes.
Once you decide which home your loved one will go into you can clarify with the home: their fees, the maximum bond amount and what interest rate they offer on the bond.
Bond, no bond or partial bond?
 |
Providing an accommodation bond reduces the daily accommodation fee to be paid, but who will provide the funds for the bond? Does your loved one have superannuation they can withdraw funds from? Does the farm have security available to borrow and fund the bond? What interest rate is offered by the home vs what interest rate would the farm incur on a loan to fund the bond? |
This analysis is best done once a home has been decided on and negotiation on rates has started with the home.
Who pays the remaining fees?
Lastly, you need to consider who will pay the remaining daily fees (Daily, Care, Accommodation, Additional/Extras)?
Some homes have places which are designed for people whose only source of income is the aged pension, in which case the aged pension and government subsidies cover most or all of their costs, and leaves the resident with a small amount of aged pension for personal spending. Other homes will have higher costs that need to be funded by the resident’s superannuation, sale of assets or contributions from their family.
Again, this is best left until you know the costs that will be incurred and your loved one’s assets/income at the time.
Plan Ahead and Discuss Possibilities
It is hard to know if someone will need to go into aged care, but talking to parents about their preferences is a good start, whether as part of a structured succession planning process or around the kitchen table.
This article is designed to provide some background in what to expect in terms of costs. If you would like assistance with reviewing the funding alternatives when aged care is becoming a necessity, please Contact Us to find out more
More Details on Fees
The “My Aged Care” website is a great source of information. A brief summary of aged care home fees is as follows:
Fees set by the government:
- Basic Daily Fee
- Covers day-to-day services such as meals, cleaning, laundry, etc.
- 85% of Single Aged Pension rate.
- Means-Tested Care Fee
- This fee goes towards the cost of your personal and clinical care, eg bathing, dressing, nursing services, medication assistance, etc.
- Rate ranges between $0/day and $256.44/day (in May-21) depending on your asset value.
However, these rates are capped both in terms of $/year and $/person for their lifetime. In May-21 the caps are around $21k/yr and $65k lifetime cap.
Note – government fees are indexed and updated 6 monthly.
Fees set by the individual home:
- Accommodation Fee
- Covers the cost of the room and will be influenced by the location of the home, whether it is a shared or private room and what facilities are available to residents.
- There is some government support to subsides this fee, which is income and means tested.
- Additional / Extra Service Fee(s)
- Each home may have extra fees depending on what is available to residents.
- Additional services may be mandatory or optional, eg paid TV services, onsite hairdresser.
- Extra services may apply to the whole home or particular rooms, eg special menus, better quality linen/room furnishings.
By Jane Crane
Change is inevitable – that is a common catch cry. It does not matter if you are a business owner or an employee; there is no avoiding it and sometimes it is your role to instigate change and at other times you are on the receiving end. Regardless of your role, there are some important points to acknowledge and knowing these points has helped me put change into perspective and not find it as daunting.
 |
My light bulb moment came during a ‘rabbit burrow’ journey on my search for a speaker for a recent industry conference program. I work with the ORM Communications team and was researching potential speakers to present on the topic of ‘how to bring about change’. |
The work that stuck with me was by Jason Clarke which he summarises in his TEDx talk titled Embracing Change. I valued Jason’s presentation because it:
- Helps position your thoughts when it is your task to bring about change.
- Helps position yourself when you are on the receiving end of the suggested change.
| My key take home messages were this: You have the choice to close your mind, lose a rare opportunity to make change for the right to say, ‘I told you so’ OR you could give it a fair chance and open your mind and risk disappointment for the chance of making a difference (summarised in the table below); the ‘sweet spot’ is highlighted in green. |  |
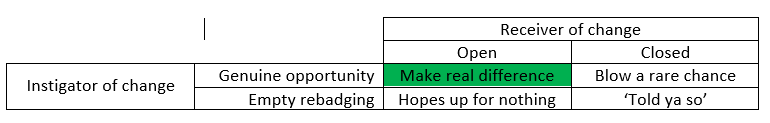
As the instigator of change, if you want to make it happen, you have the responsibility to suggest opportunities for change that are not phony and are going nowhere. You also need to own the change; take control of how it is going to happen.
As the receiver of change, you have the responsibility of giving the change a fair chance; open your mind and risk disappointment for the chance of making a difference.
 |
My role with ORM exposed me to this thought-provoking speaker and it was one ‘rabbit burrow’ I enjoyed travelling down. It has made me aim for the green box whether I am the instigator or the receiver of change.
Hopefully you’ll find some time to check out Jason Clarke’s TEDx talk and it too will open your mind to review possible opportunities for ‘practice change’. |
Reference: Jason Clarke’s TEDx talk : click here
Get in touch to find out more Contact Us
ORM compared the overall farm profit over 15 years of a Canola-Wheat-Wheat rotation under two scenarios.
- Scenario 1: Glyphosate pre-sowing knockdown with trifluralin incorporated by sowing to provide residual ryegrass control.
- Scenario 2: A split application of glyphosate and paraquat as a ‘double knock’ before sowing, in-crop application of a new mode of action ryegrass herbicide, as well as harvest weed seed control from year 8 of the rotation onwards.
Weed Wizard software was used to model ryegrass seed banks over a 15-year period.
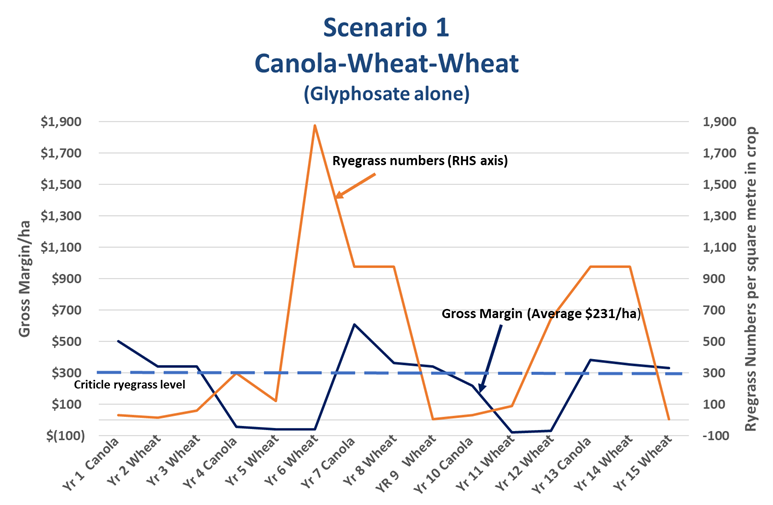
The Weed Wizard results show that ryegrass numbers are likely to increase dramatically in Scenario 1 and frequently rise above the critical ryegrass level which equates to a reduction in crop yield. Ryegrass numbers as low as 50 plant per square metre can reduce crop yields significantly and hence reduce business operating margins. Scenario 1 has a lower variable cost per hectare ($402/ha v’s $497/ha) as it utilises fewer chemical inputs however it also exhibits a lower gross margin ($231/ha v’s $309/ha) due to reduced yields caused by increased weed pressure.
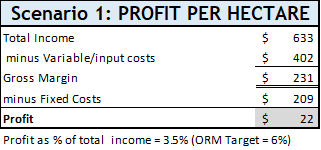
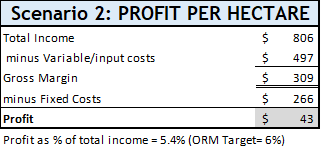
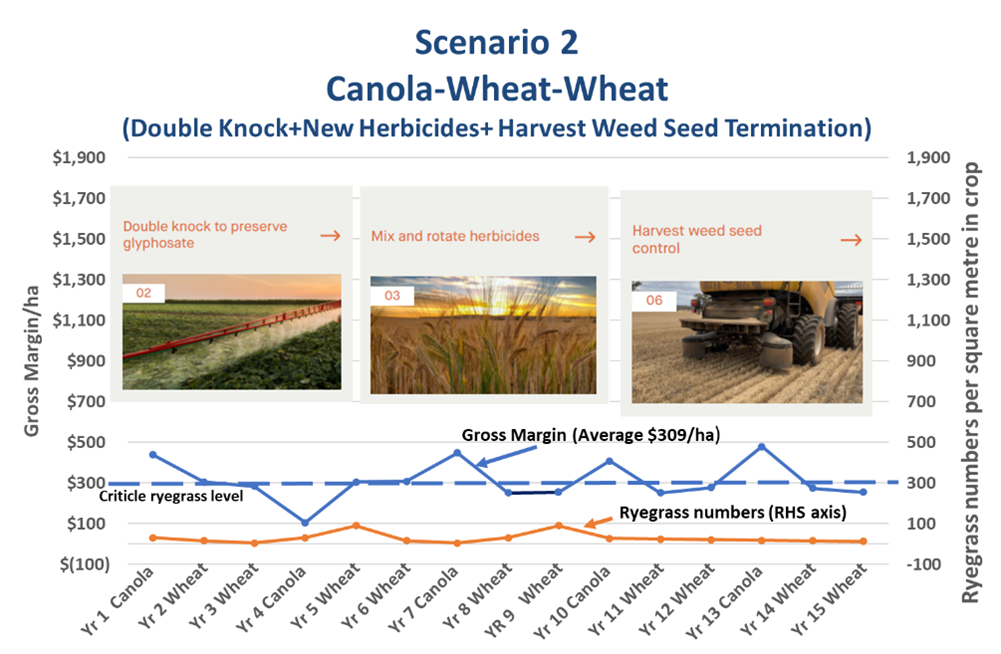
Overall effect on farm profits can be large.
The overall effect of different weed control scenarios on a model 1500ha farm over 15 years, is a dramatic fall in profit from $43/ha in Scenario 2 to $22/ha in Scenario 1. The model utilises ORM benchmark data for the fixed costs and contract rates were used for all operations. Average wheat and canola prices and yields were used to generate the above graphs (Wheat 3t/ha at $240/t. Canola 2t/ha at $550/t).
|
Scenario analysis is a powerful tool, when modelling the coming seasonal outlook for yield and price is overlayed with agronomic data such as ryegrass seed numbers it can be a powerful predictor of potential effects on future farm profits. As can be seen below Scenario 1 returns an overall profit of $33,000 over the 1500-hectare farm versus $65,000 for Scenario 2. This is almost double the profit! Scenario 1 also has a lower profit in better (optimistic) rainfall years ($325,000 v’s $481,000) and a bigger downside risk in dry (pessimistic) years (-$170,000 v’s -$102,000).
|
Scenario 1 – 1500-hectare farm
|

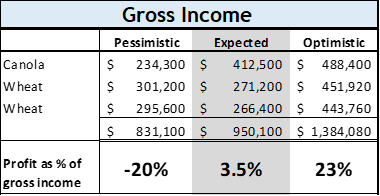
More diversity in rotations and weed control techniques drive higher profits
|
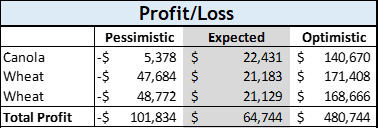
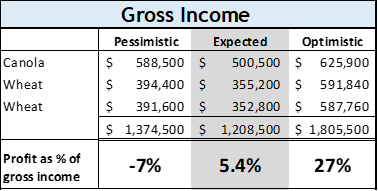

Get in touch to find out more Contact Us
| As COVID-19 and the various restrictions around it continue to bite, the Federal Government have introduced a number of initiatives to stimulate business activity, including new legislation which allows small businesses to write off or fully expense selected assets purchased since 12th March 2020 through to 30th June 2022. Let’s explore what this means for your business? |  |
What is it, and do I qualify?The new legislation is split into 2 different packages:
Another factor to consider for Instant Asset Write-Off is that you must be a small business with a turnover below $500 million, however most farming operations would qualify for this. The Temporary Full Expensing laws are also more generous on this count, as they expand out to $5 billion of aggregated income.
|
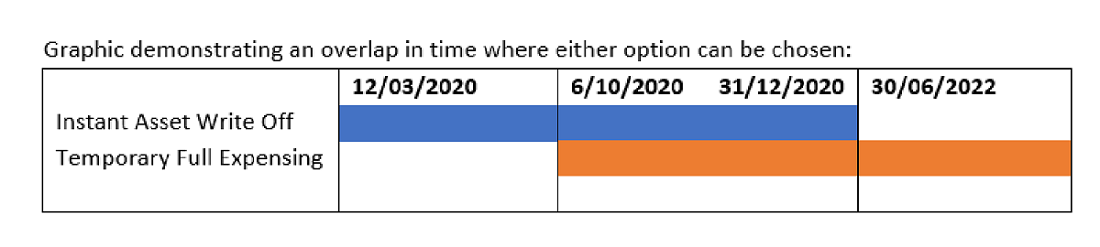

Enough of the technical mumbo jumbo, tell me how it is used!
 |
An example of how these options might be used is with the purchase of a new header. If purchased on 11th November 2020 for $400,000 this would exceed the maximum permissible expenditure amount under the Instant Asset Write-Off provisions. However, it falls into the date range of the Temporary Full Expensing option, and therefore, the entire purchase price is claimable (fully expensed) in the 20/21 tax year as long as the asset is delivered and ready for use by 30th June 2022. |
What about a new ute?
A new ute can be purchased and claimed for by either option as long as it fits the criteria of either being valued at less than $59,136 or have a carrying capacity of over one tonne. It must also be purchased and delivered by the dates mentioned in the preceding sections.
Are there any downsides to using these provisions?
Firstly, there are a couple of things to be aware of. If the asset purchased is expensed entirely in one year via either the Instant Asset Write-Off or Temporary Full Expensing option, then there will be no trailing depreciation expense to claim over the following several years. This may lead to more tax being paid in those following years. Also, because the asset is being written off in the year of its purchase, any proceeds from the sale of that asset are fully taxable at the time of the sale, without any unclaimed depreciation to offset this.
Another consideration might be that the purchase of an asset pushes taxable income into a loss, which may not necessarily reflect the year correctly, as you can see in the below example with the new header:
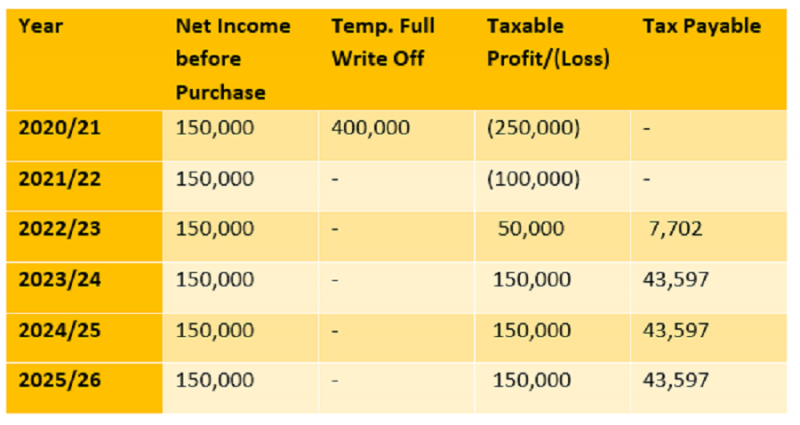
Whereas the income (and tax) is ‘smoothed’ when the traditional depreciation rates are used instead:
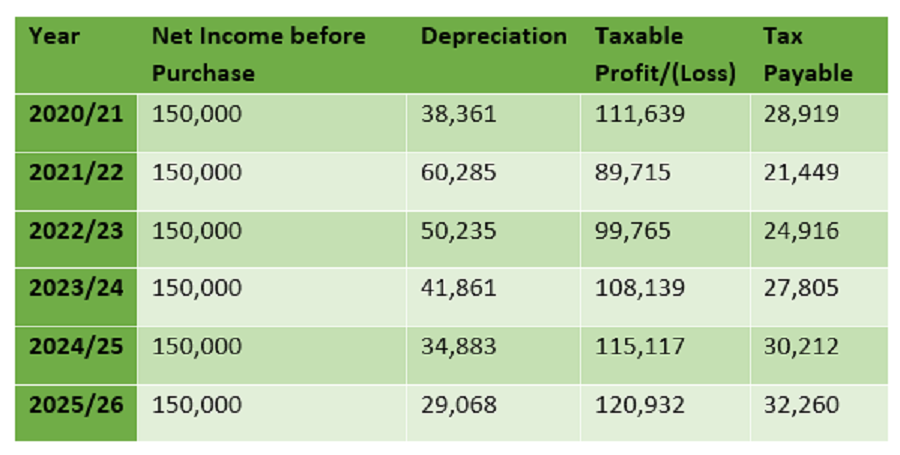
That said, in the above scenarios the depreciation method leads to an additional amount of almost $27k being paid over the 6-year period.
A case study…
Jim has had a pretty good year and decides to purchase a seeder for $300,000. He buys it on 1st November 2020, and it is delivered a week later. He gets to the end of the financial year and visits his accountant, where they discuss the seeder purchase and what his options are, including depreciating it over 15 years or claiming it upfront under the Temporary Full Expensing option. The seeder is too expensive to fall under the Instant Write-Off provisions.
| Jim has made a profit before tax (excluding the seeder purchase) of around $320,000 for the year and believes that these types of profits will stay at a similar level for the next few years. So if using depreciation this profit would be reduced by around $40,000, reducing taxable income to $260,000 and resulting in a tax bill of approximately $92,897. If Jim opts for the Temporary Full Expensing option, Jim’s taxable income is reduced to $20,000 with tax payable nil after tax rebates. |  |
Please note that the information provided above is of a general nature and may not apply to your situation. ORM recommends you discuss the Instant Asset Write-Off and Temporary Full Expensing measures with your tax adviser or accountant.
[i] Instant asset write-off | Australian Taxation Office (ato.gov.au)
[ii] Temporary full expensing | Australian Taxation Office (ato.gov.au)
Get in touch to find out more Contact Us
|
The impact of COVID-19 restrictions has been felt across all industries and while broadacre farming has been largely spared the worst effects, the absence of key employees, contractors and family members at critical times has been a feature of the last 12 months. |
 |
Expecting the Unexpected
|
Rating the Risk
The risk of any potential business disruption can be rated using a risk matrix such as the one below. There are two steps to rating the risk:
- Your estimate of the likelihood of a particular event occurring is rated on a scale from Almost Certain to Rare.
- The consequence or impact of that particular event occurring is rated on a scale from Negligible (Almost nothing) to Catastrophic.

The risk rating helps prioritise where contingency planning is required, starting with the red coded risks followed by yellow and green as the lowest rated.
One of the most disruptive events that can occur to a business is the removal from the picture of a key decision maker by either injury, illness or even death.
Roles and Responsibilities
| With increasingly complex farming and management systems, many farm businesses are taking the time to ensure they have contingency plans in place to tackle various scenarios. A tool that can be useful in managing disruption to your labour or management team is a Roles and Responsibilities table for your farm. The table becomes a snapshot of who is responsible for the key tasks, decisions and communication in the different areas of the business. | 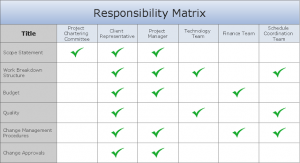 |
The table includes the following:
- The key farm enterprises and tasks e.g. crop planning, shearing, harvest, etc.
- Names of who is responsible in your business for the key enterprise activities and tasks. How many areas are under the responsibility of one person? Are they spread too thinly?
- Name of who would be ‘next in line’. By adding the name of this ‘back up’ person you are giving them permission to learn the job. It could be that they work alongside the responsible person at critical times to learn the detail behind the decision making.
- Name and contact details of any external people (advisers/contractors) who contribute expertise or labour. It is useful for the ‘next in line’ person to also get to know the key external people.
- You can also add the months of the year when the particular task/activity is most intense.
Vulnerabilities
Vulnerabilities can be highlighted by identifying areas where a single person is solely responsible for multiple tasks and responsibilities. Action can then be taken to put contingencies in place such as naming a ‘next in line’ and have that person learn the job by shadowing and mentoring with the responsible person
In summary, a few key questions to ask yourself are:
- What range of risks does our business face and what is their likelihood and consequence?
- Who are our critical people and decision makers and their ‘next in line?’
- Who are the key external advisers and contractors to the business?
- Does the whole team know, at a glance, who is responsible for what and at what time?
Watch the Agriculture Victoria Building Farm Business Resilience webinar here
Get in touch to find out more Contact Us
|
The discussion with your bank manager on the topic of interest rates often gets a bad rap when associated with agricultural businesses. A common comment from farmers that we hear is, “They only ring me when something is wrong!” However, this common misconception doesn’t do your banker’s justice. They are in fact an integral cog in your business network and have an important role to play in your farming business and as such should form a key part of your professional adviser team. |
 |
Understanding Your Current Interest Rates
|
Ways to Keep the Banker Happy
When farm businesses approach ORM for advice or assistance when reviewing their interest rates, we relay it should never be just about arguing for a lower interest rate because your neighbour has it. You need to be in a position to tell the bank about the strengths of your own business. When talking with your bank or prospective bank you are trying to paint a true, honest representation of how your business is travelling; past, present and future and to understand the three fundamental aspects that all good bankers assess their clients on, the three ‘Cs’: Cashflow, Collateral and Character.
Questions to ask yourself about the three ‘Cs’
| Cashflow: Is your business able to generate a surplus going forward into the next 12 to 24 months while also sustaining an acceptable level of serviceability? Are you meeting your interest cost requirements currently and are you able to repay your debt over a 15 to 25-year period?
Collateral: Does your business have enough security to borrow against? Typically, there is other pre-existing owned farmland within your business, but it can also be other farm assets like a permanent water right and feedlot structures. Most banks will allow borrowing up to 50% equity and if the above ‘Cashflow’ requirement is met they may allow borrowings up to 70% equity. Character: Are you always honest and transparent in your approach with your bank? It is important not to hide important upcoming matters like machinery purchases or land purchases, making sure you keep your bank in the loop regarding major financial matters that will happen within your business. |
 |
Negotiating with Your Bank – Tips and Preparation
The age old saying ‘Sharpen your Pencil’ comes to mind whenever you are talking with bankers about interest rates. Table 1 will hopefully make it a bit easier to decipher where your interest rate should be, given your current borrowing level and risk profile. (n.b. Table 1 is only our basic guide on the current lending environment and is subject to change on a monthly basis).
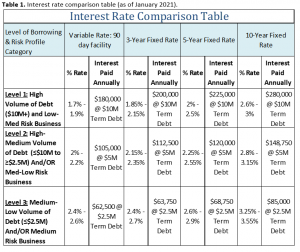 |
Get in touch to find out more Contact Us
How are you going?
| You probably have a pretty good gut feel of how your business is going. But is your gut feeling skewed because you like to keep up with the ‘top farmers’ in the district, or because you like machinery and don’t like sheep?
Benchmarks summarise factors in a business in a manner that enables useful comparisons between years and between businesses. They provide an objective assessment of your business, taking the gut feel out of the decision-making process. |
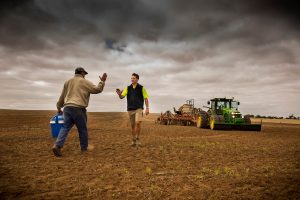 |
Benchmarks can help identify which parts of your business are working and where opportunities exist. You can find out how the ‘top profit’ farming businesses are doing, to see what is achievable.
|
What are you trying to achieve?But let’s start with the basics – before looking at how your business is performing you need to think about your business and personal goals. A few key factors to consider are:
So, do you want to have the best crop yields, have a better work/lifestyle balance (that suits all in the business 😊), minimise the impact of poor seasons, build for the next generation …..? By understanding your own goals, you can then direct your efforts and resources in the right direction. |

The figures are great, but what do they mean?
Data from broadacre farms across Australia (predominately in South Australia, Victoria and NSW) has been collected in the AgProfit® database. Key benchmarks have been developed and ORM consultants use them to focus clients on their business’s strengths and weaknesses (i.e. opportunities 😉) and review how that fits with their goals.
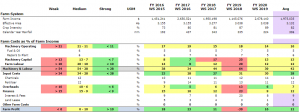
Figure 1 Example of Farm Costs KPIs for an individual business. Source: Ag Profit® 2020
FY = Financial Year, WS = Winter Crop Season
Focus on the 5-year average (Avg column), as this evens out the impacts of poor seasons (e.g. WS2018) and income/costs being spread across financial years for tax planning / cashflow reasons.
Looking at the table above, what can we see?
- Machinery & Labour costs are in the medium range. Machinery Capital (depreciation) is getting toward the Weak range due to recent upgrades to key items, but this is offset by low Labour costs.
- Input costs are strong (ie well matched to production); Finance costs are in the medium range.
What next? Going through the report with others in your business is a great way to encourage communication and invite others to participate in the direction of your business.
|
The review of the report may identify:
|
 |
How to start
Benchmarking only tells part of the story but it is a good way to assess how the business is currently performing.
With the 2020 season almost wrapped up, and the 19/20 financials likely to be completed soon, it is an ideal time to consider being involved in ORM’s free Benchmarking project. We will provide you with a summary of the last five years and a 30-minute meeting with one of our experienced consultants to identify the key issues the business should be addressing.
Get in touch to find out more Contact Us
Rising Land Values
Whether you’re at the local pub or having a yarn with your neighbour, chances are that the topic of land values will come up in conversation. The rising value of Victorian farmland continues to catch many farmers by surprise. This leaves them scratching their heads and asking the same questions; why might this be occurring, is this positive for farming businesses, and how does this compare with other investments?
Regional Overview of VictoriaVictoria’s mixed farming regions are great examples of areas that have seen rises in farmland values. The graph below shows that land values ($/ha) have risen quite substantially over the past 20 years for all regions. The extent of these rises over this 20-year period is shown in the dot points below:
Figure 1 Comparison of regional land values for Victoria’s mixed farming regions. Source: Ag Profit® 2020 This graph has come from the Ag Profit dataset and should not be used to value farmland. The Western District is the standout performer since the year 2000, while the other regions have been consistently growing on a yearly basis. This historical rise in land values begs the question; what are the market drivers that keep pushing these values higher? These drivers will vary between regions, but ORM believes the most common ones are:
|
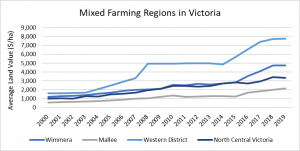
Returns from Farmland
Table 1 below shows the annual growth rate of land values in Victoria. The growth for all regions (besides North Central Victoria) has been much higher in the past 5 years when compared against the 10-year and 20-year average. For example, farmland in the Wimmera region has achieved an average annual growth rate of 10.4% since 2015. This is positive for farmers because the land’s (an asset) growth in value directly increases the owner’s equity. In addition, the profit earned from farming or leasing will also contribute to the overall return. Therefore, the combination of growth and profit will determine the land’s overall Return on Investment (ROI).

Table 1 The average annual % growth per region, exclusive of profit. Source: Ag Profit® 2020
This table is based on the Ag Profit dataset and the % growth will vary between local districts within these regions.
Investment Comparison
Farmland has not been a traditional asset in an investor’s portfolio. However, ORM has noticed that the sound returns have attracted more attention from investors recently. This is because the combination of an increasing asset value plus the ability to generate profit hits the ‘sweet spot’ for some investors, depending on their investment strategy. The table below shows that the average return of 8.0% from rising land values is competitive with the traditional growth assets (real estate and shares) and defensive assets (bonds and cash).

Table 2 Comparison of returns for different types of investments. Source: Vanguard 2020 and Ag Profit® 2020
Rising land values continue to attract the attention of the Victorian Agricultural Industry. Based on the trends shown in the graph, you could assume that values will continue to rise over the long term. Farmland has provided a strong return in recent years, resulting in many farmers and land holders successfully growing their equity. Are you interested in knowing how rising land values have impacted your equity and what this means for your business? If so, then get in touch with ORM / Ag Profit® and enquire about our FREE benchmarking service.
Get in touch to find out more Contact Us
Employing Harvest Casuals
Harvest is a busy time for farmers and their casual employees (harvest casuals), play a crucial role in getting the crop in. Ensuring harvest casuals are satisfied with their employment conditions is always a high priority for farmers. However, the lead up to harvest comes around quickly, which sees many famers overlook the essentials of recruitment and compliance for their harvest casuals. It’s important to get this right, as disputes can be stressful and often costly. Taking the time to sort out employment contracts, award rates, penalties and benefits can be the difference between a swift harvest or a stressful one.
Employment ContractsEven though you might only be hiring a farm labourer on a casual basis for a few months’ work, it’s important to draw up an employment contract. An employment contract is an agreement between the employer and their employee that sets out the terms and conditions of employment (T&Cs). For example, the T&Cs may outline the role, expected hours, remuneration package, length of employment etc. The T&Cs must not be less than the legal minimum entitlements set out in the National Employment Standards. |
 |
Award Rate
Awards are a legal requirement that farmers should use to determine wages for harvest casuals. Listed below are the two common awards that are most relevant to harvest casuals:
Pastoral Award
(Applies to broad-acre mixed farming enterprises)
• Chaser bin operations
• Harvesting
• Cutting/windrowing
• Baling
• Stacking
• Loading/Unloading grain bags • Carting grain/seed
Link: Pastoral Award MA000035
Road Transport (Long Distance) Award
(Applies to trucks leaving the farm gate)
• Carting hay
• Carting straw
Link: Road Transport (Long Distance Operations) Award MA000039
The most applicable award should be chosen on a case by case basis.
The awards outline the national minimum that can be paid to employees. There are a few things to keep in mind when looking at these:
• Ensure you’re looking at the casual rate section; There are different rates between casuals, full-time and part time employees
• Ensure you’re referring to the correct classification section; There are different types of classifications in each award
• Ensure the casual employee is paid at the correct level; The level should reflect the employee’s skills and experience
For example, a farm hand with less than 1 years’ experience has been hired to drive a chaser bin. The employer will look at the following to determine the farm hand’s wages:
• Award – The Pastoral Award
• Employment Type – Casual
• Classification – Broadacre Farming and Livestock Operations
• Classification Level – Farm and Livestock Hand Level 1
• Rate – $24.36/hour + penalty rates where applicable
Fair Work announced a 1.75% increase to minimum wages in June this year. This comes into effect on the 1st of November 2020 and will apply to the Pastoral and Road Transport (Long Distance) Award. Click on the link to find out more: Fairwork 1.75% pay rise
Penalty Rates
It’s common for harvest casuals to work long and irregular hours. When this occurs, employees may be entitled to receive penalty rates to compensate them. The types of entitlements vary between awards, but often includes overtime and public holidays. It’s always important to double check the awards to make sure casuals are receiving the correct penalties.
Employee Benefits
A common mistake ORM has witnessed is when employers deduct benefits from the casual’s hourly rate. Harvest casuals may receive benefits from their employer, such as accommodation, fuel, a vehicle or a mobile. Employers can deduct these amounts from the casual employee’s gross earnings, but not the hourly rate. The casual employee must be paid the minimum rate as per the award before any deductions. It’s important to get this right and agreed to in writing with the employee prior to starting employment.
Now is a great time to put the above points into action if you’re employing casuals this harvest. Taking the time to organise employment contracts, awards, penalty rates and benefits can help clarify what is expected of the harvest casual and the employer. If you’re looking to become an employer of choice, then a great place to start is by visiting the Fair Work website – Fair Work website
ORM can also assist farming businesses with their HR needs. Get in touch to find out more Contact Us
Tips for managing cashflow through 2020
There will be practical challenges in operating a farm business through the rest of this calendar year. Logistics and supply chains are likely to experience disruptions, through restrictions on operations and surges in demand, such as we saw impacting supermarkets through March.
In 2020 planning will be more valuable than ever to farm businesses. It will be good practice to allow additional lead times for critical tasks and planning to be conducted early. Detailed operational plans will be invaluable to managing disruptions and making the adjustments needed to keep operations running on time. Cashflow planning will support adaptive and flexible management decisions, including the timing adjustment of sales and input acquisition well in advance.
To manage cashflow through 2020 the best planning will be a farm budget.
|
Farm managers monitoring their cashflow. |
Why banks like budgets…
As we move through 2020 it is likely that the demand on the banks to assist with cashflow pressures will increase significantly. Agriculture has not been as heavily impacted as other sectors of the economy. However a substantial increase in demand for banking services will impact how they reallocate their resources. This could mean a considerable increase in their lead time to process lending applications.
Banks like budgets because they tell the story of your farm in their language. Agronomy reports are the language of Agronomists and budgets are the language of bankers. A well-prepared budget will inform a bank about everything they want to understand about your farm, when processing a loan application. Banks will not have time to collate your data and interpret verbal instructions, you will need to present applications that are, well prepared and detailed.
Financial statements prepared by your accountant tell part of this story but not all. They tell us about the past and budgets talk about the future. Bankers have a saying that “using financial statements to lend money is like driving a car looking through the rear-view mirror”.
If you need additional cashflow relief throughout 2020 it will pay dividends to be well planned. Ensure your 2019 Tax returns are finalised and set a budget for the next 12 months. If you would like further information on budgeting, or assistance with budgeting for your farm please contact ORM. Contact Us
A message from Phil
High Cost Paddocks and their profit risk.
Fertiliser markets – What is all the fuss about?
ORM brings International Guest to Bendigo
Update on happenings at ORM – Welcome Dan Duggan
A Message from Phil
The hay market must be HOT when a buyer offers you $25 per tonne more than your asking price, if you’ll sell them four loads instead of two!
And where are grain prices going? If I use the pricing at my local grain handler site, beans were $490/t at harvest, they’re now $710/t, a 45% rise in 8 weeks. Barley was $240/t at harvest it’s now $295/t a 23% rise. The interest cost on carrying the beans for 8 weeks is approx. $3.00 per tonne against a return of $220 per tonne – a no brainer to hold! But when do we sell? There’s plenty of market intelligence around to help inform our marketing decisions. However there’s a bit of crystal ball forecasting in any forward estimates.
Hold or Sell?
The trigger to sell grain or hay is often to meet cashflow needs. But should that be the case? A few years ago, when grain was worth half current prices. I presented business cases to a few banks asking them to extend the clients trading facilities. This was so that the client could hold grain for 12 months in anticipation of better prices. The attitude of the banks at that time, and currently, was that if holding grain required an increase in bank debt to finance cashflow, it had to be secured against strong equity in land. Otherwise bank’s were of the view that holding grain was speculating on markets and hence a financial gamble which they did not support.
We can assume the Banks position is based on sound advice from their specialist analysts and advisors. Hence we could conclude that carrying grain has financial risk, no matter how confident or informed our own marketing position is. However, making the decision to carry grain for a 23 to 45% return in 8 weeks is the best investment I’ve heard in a long time. So carrying grain and hay has been a good business decision for harvest 2019. But do we continue to carry to see what the market does? When do we pull the sell trigger? If we miss the top of the market by holding too long, can that be justified by the return already achieved?
I’m still riding the price wave, and hoping the crest is still a little way out there yet.
ORM does not provide advice on grain/hay pricing, there’s others that specialise in that area. The crystal ball relies on their knowledge and market intelligence.
Contact Us : with your feedback
What’s news?
- Client reviews with ORM are showing harvest 2019 income is 20 to 50% above budget. Extra income transfers to extra profits, so happy times!
- Remember the most important asset in your business is the people. Celebrate the good year by ticking off some of the goals you and your family have been working towards.
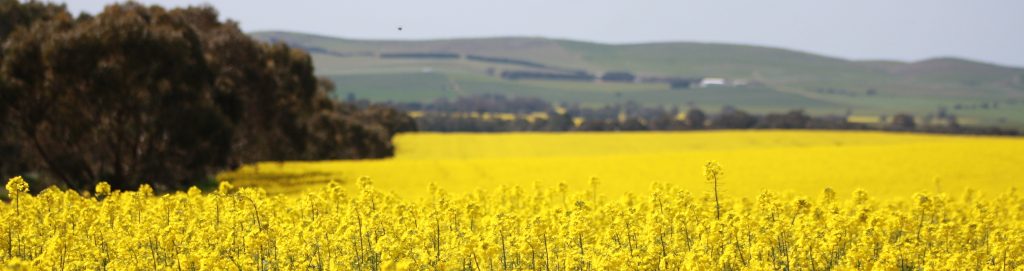
High Cost Paddocks
Identifying the high cost paddocks
High cost paddocks refer to paddocks with a known weed, pest or nutrition issue. They can be identified at annual planning time. Paddocks known to have the highest annual cost per hectare relative to their potential income, are the high cost paddocks.
The financial risk is greatest in the high cost paddocks
High costs paddocks present the greatest risk of financial loss in a low-income year. The low-income event could be due to a grain prices or an adverse seasonal event. Where production costs are high, relative to income, there is a limited ability to absorb production losses. A better financial outcome may be achieved by removing them from the crop sequence. This would reset the paddock in readiness for reintroduction into the crop sequence the following cropping season.
Some businesses will accept the outcome from high cost paddock/s. Its’viewed as part of an overall sequence of enterprises which is profitable in the medium term. This is justifiable however often the weakest link in the chain, the high cost paddock can cause a ‘leakage’ of profit over time.
Substantial shift in farm costs
Since 1994, total annual operating costs per business in the Wimmera-Mallee farming systems have doubled, and in some cases tripled (Figure 1).
The increase in total costs per business is due to growth in scale (area farmed), intensification of cropping rotations and higher inputs. To manage problem weeds and maintain fertility in response to a more intensive cropping system, chemical and fertiliser use has increased.
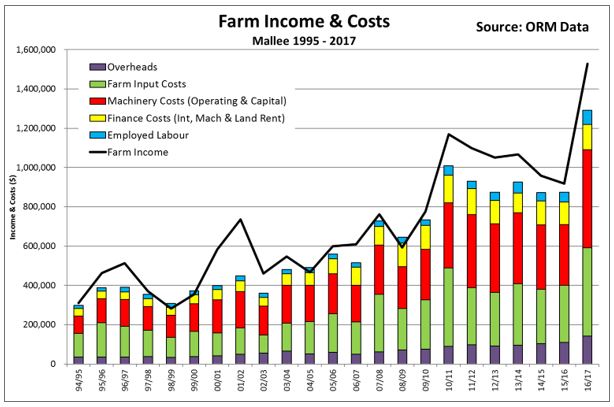
Figure 1 – Farm Income & Costs Mallee 1995-2017. Source AgProfit
Seasonal volatility
Losses can result from an unexpected grain price drop, frost event, heat spike and/or an extended dry period. These events cause seasonal volatility of income and profitability.
Resilient farming systems are those that operate profitably in more years than not. Farming systems that achieve lower income volatility and lower total costs have more profit years. As a result, the potential for and impact of losses due to difficult seasons are reduced in frequency. Hence the risk of core debt increasing from these ‘loss’ years is less.
So how do we make our farming system more resilient?
The Farming System
Adopting the farming system that suits the environment and the characteristics of each business determines the potential profit.
The selection of enterprises and the frequency of re-occurrence of particular enterprises in the land use sequence over time are critical components of the profitability framework of a farming system. The appropriate farming system for each business depends on factors such as:
- Costs, including fixed and debt servicing
- Availability of resources (Machinery and labour can be provided by contractors)
- Management preference and skills
- Physical characteristics of the farm – soil type, topography and lay out
- Seasonal climate and weather patterns – rainfall reliability, frequency of extreme events such as frosts, heat spikes and wind
All of these factors will influence the risk profile of the farming system which is best suited.
Less can be best
If profit is frequently absorbed by high costs and income volatility. Then farming system that achieves the equivalent profit with lower costs per hectare and less fluctuation of income is preferable. Breakeven income is achieved when all costs are covered. In most seasons yield is correlated to rainfall. Therefore, if costs per hectare are lower, then the breakeven yield is also lower. This results in more years when a profit can be achieved. When rainfall is unreliable, a farming system with lower costs per hectare has potential to make profits in more years. More profit years contribute to stronger profitability and a more resilient farming system.
In Conclusion….
- Farm profit performance can be influenced by:
- Removing the high costs paddocks from the crop rotation.
- Reducing costs per crop hectare on the remaining cropped paddocks.
- Making profits in more years due to lower overall costs.
- Managing costs, reducing income volatility and achieving consistent profits (i.e. profit during most years). All contribute significantly to maximising the long-term operating returns and financial sustainability of the farm business.
Back to Top
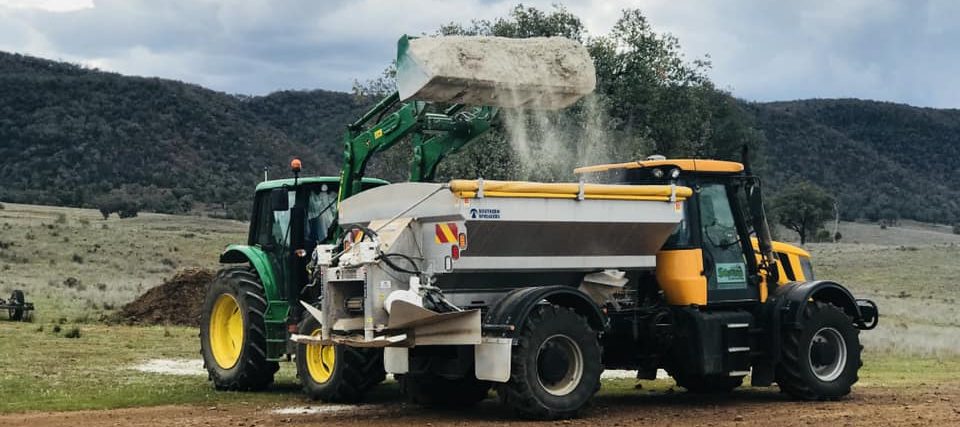
Fertiliser Markets – What’s all the fuss about?
You’d have to have been hiding under a rock in recent months not to have been baled up by someone wanting to chat about the fertiliser market. Where it’s been, where it’s going and if it’s a good time to lock in some volume at current values.
With this in mind, we thought we would take some time to have a closer look at what’s influencing the fertiliser markets and look at the topic in a whole farm context. Hopefully arming you with some tools to rationalise these conversations and bring them back to what works for your enterprise specifically.
What is happening in the fertiliser market?
Great question, and the answer is as convoluted as most commodity market pricing mechanisms are.
But there are a few key points that we can focus on currently:
- Fertiliser markets ARE lower.
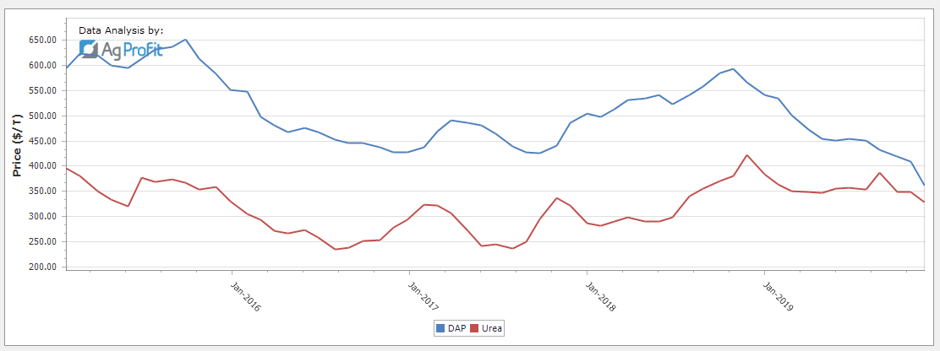
Fig 1 – DAP and UREA price per tonne Jan 2015 to Jan 2020. Source AgProfit
Currently we are seeing multi year lows across fertiliser products, which anecdotally looks to provide a great opportunity to reduce input costs accordingly. There are a few factors to consider in this though:
- It is always hard to split the talk from the reality in markets like these that have no real exchange. Transparency is limited and at times there appears to be a complete disconnect between offshore markets and local pricing.
- The main drivers of pricing are offshore values (as above in AUD terms). Driven by natural gas markets, global supply and demand, and currency exchange.
- As an importer of fertiliser products, our supply, vs demand vs timing quantum, can sometimes throw our local pricing relativities into overdrive, or flatline them.
- Domestically it is a supply and demand driven market in its truest from.
What should I consider for my business?
Each farm business needs to reflect on their own needs and situation. Before purchasing based on price alone, assess other variables that may provide a measure of value to the business.
- Start by looking at your historical use and cost of fertiliser. Measure this against the income for previous seasons.
- If you fall within a range of 12% or lower for fertiliser costs as a percentage of farm income. Then your input costs for fertiliser are being well managed.
- Use this same comparison on current pricing, overlain with your cropping plan for the coming season, budgeted use and forecast farm income.
- This comparison should help highlight, for your individual enterprise, the actual tangible benefit of current values in terms of input cost vs farm income as a relativity.
Price volatility ….. what to consider.
As with any commodity market, particularly one influenced by available tonnages and by local demand, volatility is always a risk. The current values are lower than previous years, the drought has no doubt exacerbated the offshore and international influences (which have also pushed markets lower), but there remains this volatility risk.
Locally some of these include a large rainfall event that stimulates any late summer cropping in the north. Or the east coast coming back into a more average rainfall cycle, stimulating more planting and therefore more demand. If this happens in a rush, and the timing of available tonnages does not line up, then the supply demand equation may tip.
In saying that, the opposite does hold true, and we know that the east coast has a long way to go before this scenario is likely to eventuate. If offshore values remain soggy then hopefully we see a solid reduction in a major input cost that translates into a much better return per ha for growers.
To conclude; fertiliser markets appear to provide a good opportunity at present to lock in a lower input cost for the coming season. However, prior to deciding on this based on price alone, it is important to look at your enterprise in its own right, decide where you fit, and what works for you.
As always, there remains risk of markets moving in either direction. This is why getting comfortable with your decision to lock pricing in based on a whole farm perspective is the key to making informed, relevant and profitable decisions for your enterprise.
The take home message here is ….
Whilst values are low when reflecting on the last 5 years or so. It is important to understand what the actual value to your own business represents. This may allow you to;
- Capitalise on lower pricing, and lock that in to bring you into a better benchmark cost vs income ratio. Alternately if you are already in a healthy range, it may allow you some flexibility in exploring potential further downside in markets, whilst knowing where your ceiling price is to maintain your current healthy ratios.
- Increase rates of other trace elements to build ongoing reserves, whilst also maintaining a healthy cost to income ratio. This is a good example in maintaining your benchmark expenditure targets, whilst investing in future yield potential.
Whilst there is a lot of talk around in this space, it is a good idea that each enterprise takes the further step of analysing these values relative to their whole farm enterprise. Rather than making a decision based on pricing in isolation.
Back to Top
International guest to be key note speaker at upcoming events.Image: Keith Norman from Stamford in Lincolnshire, U.K. |
 |
One of the ORM Communications’ team most challenging but rewarding projects is the annual planning and delivery across Southern Australia of the GRDC Grains Research Updates. Since 2009 ORM has convened these grains industry flagship events. The team are as excited as ever about the February 2020 programs. The aim of the events is to inform and challenge grain growers and their advisors as we enter the third decade of the 21st century. ORM consultants have been in discussions with researchers, advisors, growers and the GRDC since June to define and refine the final programs.
Upcoming event – Bendigo, Victoria.
The Victorian event is the two-day Update held in Bendigo on February 25 & 26. The program boasts an in-depth analysis of a range of ‘farm ready’ research along with some big picture perspectives, including an international perspective. ORM has harnessed its extensive grains industry networks to engage Keith Norman. Keith is a highly respected farm consultant from Stamford in Lincolnshire, UK, who will provide insights into the production targets being met under the strict regulatory environment imposed in the UK. Keith is also a wealth of knowledge on pushing yields towards the theoretical maximum and the required agronomy in a high rainfall environment including nutrition and fungicide management.
The GRDC Research Update Bendigo program will also take a deep dive into new and emerging pre-emergent herbicide products. The focus will be how we will get the best value from these in our farming systems. Two well-known herbicide experts, Dr Chris Preston and Mark Congreve will lead these sessions. The best management of pastures in rotation with crops will be addressed by southern NSW based consultant, Tim Condon and Dr James Hunt from La Trobe University. Tim and James will scope out the potential to bust the big yield constraints facing the industry.
A diverse program will set the scene for the industry productivity and profitability talking points for 2020. To view the program and register for this and other events go to www.orm.com.au
Back to Top
Update on happenings at ORM
We welcome Dan Duggan to the ORM Team.
Dan’s a highly motivated, skilled individual who has a passion for the Ag Industry and brings a broad range of experience to ORM. He’s worked on livestock and cropping properties, as well as in soft commodity trading, marketing and risk management, into domestic and export markets. This combined with his oversight and execution of large-scale infrastructural projects and general management of large highly skilled teams, means he brings a diverse range of skills to the ORM team.
For the best part of 15 years Dan has worked in the grains industry providing growers with risk management advice and marketing options as well as trading grain, oilseeds and hay into domestic and export homes. He also previously worked in recruitment and the agricultural resourcing space, so he understands the challenges of finding the right person for the job.
When Dan’s not working you can generally find him with his growing family, in the garden or on the river sneaking in a fish.
With a diploma of Commerce majoring in Agribusiness a well as being PS146 Accredited in Managed Investments and Derivatives, Dan also possesses a range of industry specific qualifications including a Certificate in Grain Trading (Grain Trade Australia), Trade Rules and Dispute Resolution Accreditation, Grain Merchandising, Grain Quality Standards Certification, and Certificates in Financial Markets Technical Analysis.
ORM welcomes Dan who has recently moved back to central Victoria after a stint in QLD and is looking forward to working with ORM clients across a broad range of areas.
Back to Top
A message from Phil
Making farm business decisions in the face of uncertainty
Motivating & Managing labour effectively
Business Reviews
Update on happenings at ORM
A Message from Phil
While growers get going with harvest, the ORM team are busy planning the next round of grower and advisor events, in early 2020. So our goal, is to help the industry stay informed of new initiatives and opportunities. This is why we research and talk to others in the industry to gather the most relevant materials.
Some topics being considered for delivery at events next year include:
- Managing public perceptions to reduce ‘trial by public opinion’
- Building a constructive and positive culture within the family business
- The return of pastures to crop rotations
- Impact of trade wars and sanctions on grain prices
- Plant proteins as an alternative to meat
- Building sustainable carbon pools
- Taking a profit first approach
If you’ve got ideas and would like to share them, the ORM team would appreciate hearing from you.
Contact Us : with your feedback
What’s news?
- Mallee/Wimmera/Central hay yields are excellent, up to 11 tonnes/ha of oaten at No1 grade
- New machinery often comes with new technology, i.e. new hay balers have double the capacity
- Drought declared areas have access to infrastructure grants
- If you’re looking at a big harvest, contractors are available
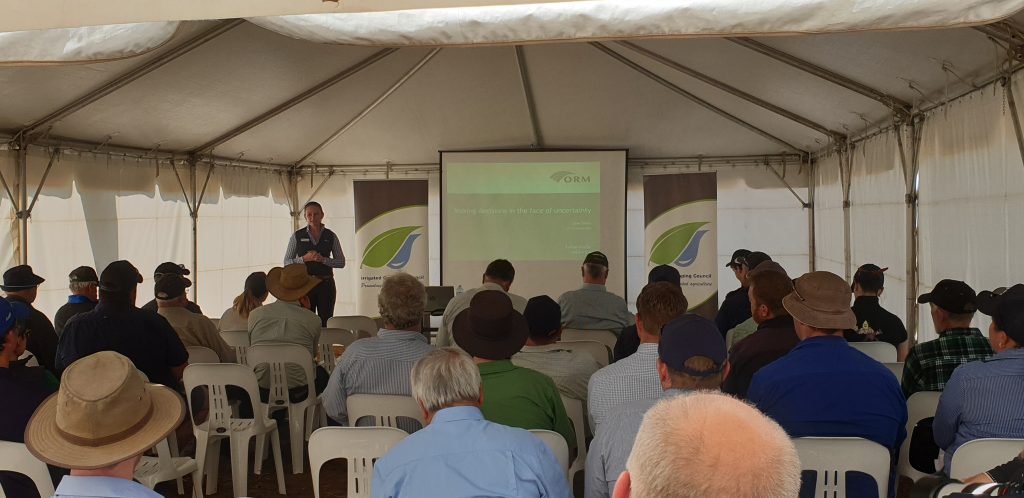
Making farm business decisions in the face of uncertainty
by Jane Foster, ORM Agribusiness Consultant.
I was recently asked to speak about the challenges that are faced while making decisions, when there is a high degree of uncertainty about the future. Making decisions when the future feels or looks uncertain, diminishes our confidence and increases anxiety or stress about the outcome. Below are some practical tips for decision making in these circumstances;
Tips on decision making when the future is uncertain
- Reduce the time horizon for decisions 3-5 versus 5-10 year timeframes.
- Become more informed, knowledge has a habit of reducing uncertainty.
- Defer the risks within your control when uncertainty is high.
- Avoid emotional risk taking – risk taking should be based on clear, calm and rational thought.
To make decisions which are for the longer term and/or are more difficult to implement and exit, one of the key goals prior to confirming a decision should be to eliminate as much uncertainty as possible. And this can be achieved by using discipline in the deliberation process and a clear approach to the issue.
How to reduce uncertainty
Take a view on how the future will evolve in your industry ….
What are likely to be the key forces that shape the industry over the next 3 – 5 , 5- 10 years. But predicting this is the difficult part, engaging with industry representatives and your network of advisers will help in this step.
Identify what success is for your business …
Articulate the key milestones and goals that you would like to achieve over the next 3-5 years and beyond. Then stay focused on these as you make and implement your decision.
Explore your available options that support the business in achieving these goals….
This could be a diversified business strategy, adoption of new technology/automation or a focus on cost control. What will you be required to do, to move the business in the direction required.
Quantify the costs and benefits of alternatives if there are more than one….
Outline the likely investment that will be required to implement the action. Do assets need to be acquired or liquidated? Can management readily adapt the business? Would specialist expertise be required?
Assess if the change is realistically achievable define a timeline to implement the change…..
Are there significant hurdles which will be difficult to overcome. Compare this against “maintaining status quo”. Which is the most feasible option in the current circumstances?
Make a decision, then make a plan for implementation……
Understand the risks involved and have a plan to deal with them should they eventuate. This is key to reducing uncertainty. So consider utilising external expertise at this step to help with the assessment of risk and the planning to manage it.
Review the outcomes and the implementation process……
Did the outcome achieve our initial expectations? What do we need to keep working on? What worked well and why?
Taking the required time to plan and implement a significant change in your farm business will be a productive investment. By decreasing the feelings of uncertainty, we improve our confidence in the decision-making process. As a farmer you cannot avoid making decisions, so it is a good option to approach them with clear thinking and a rational plan to reduce some of the stress.
Back to Top
 |
We look at how to motivate and manage the labour force effectively |
The specific requirements of labour management will vary over time. You will typically move between the key stages of sourcing labour, retaining labour, motivating labour and managing performance. Compliance with the legislative requirements of Awards and Agreements, is the foundation of HR management in all business enterprises. However compliance does not directly influence the level of performance of managers and employees. As with all aspects of running a farm business, managing employees requires specific skills and the implementation of some general processes. The goal is to create a working environment for farm employees to be efficient and effective in their roles.
Employees can be most effective when;
-
Their role has clear definition and they understand what is expected – eliminate micro-management.
This enables staff to be productive even if you are occupied elsewhere, because they have clear direction on the order and priority of tasks.
-
Management engages in clear and consistent communication – lead by example.
If your communication is currently ineffective, initiate structures that implement a consistent approach. A weekly tool-box meeting could be a starting point.
-
Under-performance is addressed effectively – this may result in more training or changes to systems.
An under-performing employee can erode the morale of the work force if they are not managed appropriately.
-
There is an inclusive attitude – their feedback is acknowledged and valued.
Feedback may not always be implemented, this is ok but explain why it was not. And if staff are not providing any feedback this should serve as a red flag.
-
Offer incentives which reward the behaviours which are most highly valued by you.
Cash incentives are just one mechanism. Providing additional hours of leave may be of more benefit to the employee, or sharing in participation at industry events.
The most critical competency is, without a doubt, effective communication. But don’t be misled that effective communication requires a lot of talking. As it actually requires clear and consistent directives which are supported by actions.
Benefits to your bottom line
The long-term benefit of taking the time to manage staff in a positive way is that staff retention makes good financial sense. The cost of replacing an employee on an hourly rate of $30 per hour, in a business with less than 5 employees, is approximately $20,000 per employee (Business Victoria Staff Turnover Calculator). Quantifying the direct and indirect costs attributed to the recruitment and training phase of employing someone new, provides a strong business case for improving retention.
ORM works with many clients to provide support to their HR Management. This includes drafting of employment contracts, facilitating employee reviews and follow up. As well as support to the farm to manage compliance of their HR obligations. We are available to discuss individual issues or address broader business requirements.
Read more about sourcing skilled seasonal labour
Back to Top
Business Review Season 2020 – a time to reflect and prepare.
While our clients are busy finishing hay and getting ready for harvest. It is also a busy time at the ORM office preparing for our business review season. Each year we analyse our clients’ business performance and reflect on their past season results, while planning for the upcoming year. To do this we use AgProfit, a cloud-based program which allows us to record harvest results, rainfall and financial performance. It is this historical data that helps us set realistic income targets when budgeting, and pinpoint areas in the business that are thriving or require greater focus.
During the Annual Business Review meetings we measure benchmarks to provide feedback and advice, on cost to income ratios and farm income. However the most powerful part of the review, is formulating strategic plans with our clients to realise family and personal goals, such as business direction, wealth creation targets and lifestyle choices.
The following reports (Fig 1 & Fig 2) are examples of reports that can be generated from client data.
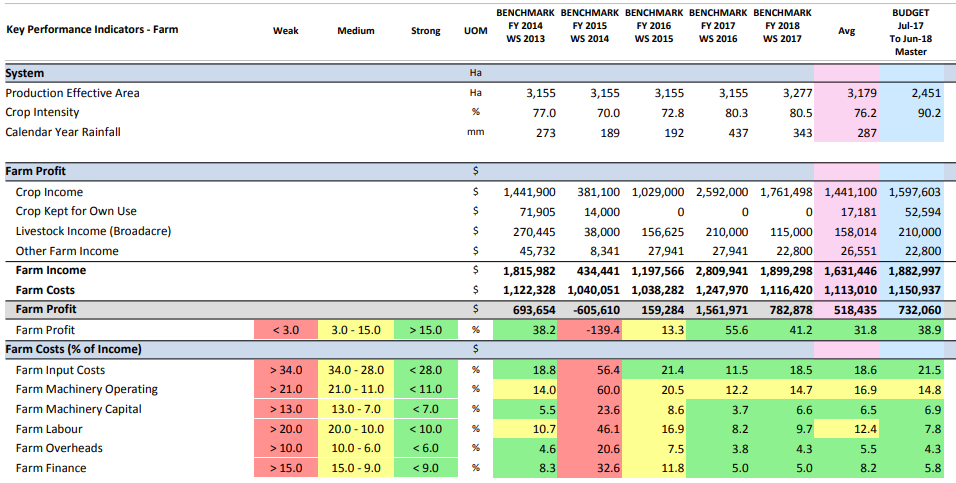
Figure 1: Benchmark previous 5 years financials plus budgeted figures.
Reviewing the AgProfit benchmarks, this business returned weak benchmarks in the 2015 financial year. But further analysis confirms that this was due to drought conditions resulting in a significantly lower income level that year. So when creating a budget for the upcoming year, it is best practice to compare the forecast, to the 5 year average performance of the farm business. By utilising an averaged reference, the income and expenses set in the budget are realistic as they are based on past performance.
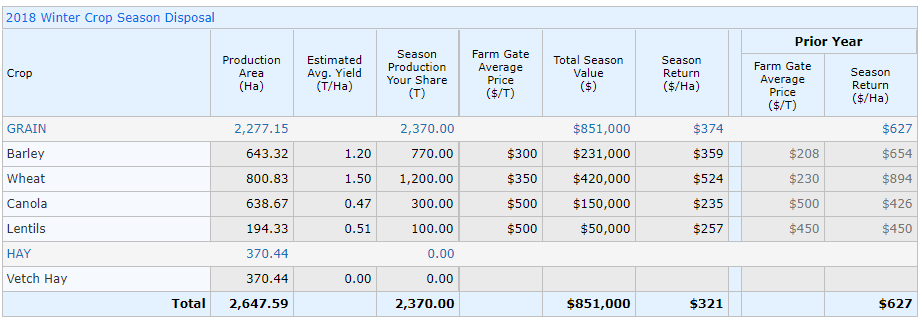
Figure 2: Current harvest results summary table.
Figure 2 summarises the current harvest and compares it to the previous year. It shows that the harvest return for this farm was $321/ha compared to the previous year of $627/ha. It also indicates that the vetch hay wasn’t baled, as no yield was recorded.
For new clients where they may not have long term data, it is adapted by using their district average returns as a base point.
If you would like to better understand your business’s current position, give ORM a call on 03 5441 6176 to arrange a Business Review meeting in 2020.
AgProfit – Budgeting and Benchmarking support for farm business
Back to Top
Update on happenings at ORM
Barb Smith, ORM’s Communications and Marketing Manager made the decision to retire from her role in October. We bid farewell to Barb with our warmest wishes and gratitude for her work over the past 3+ years. Barb was a central member of the ORM Communications team who co-ordinate and deliver the GRDC Research Updates in the Southern Region and the GRDC Farm Business Updates in the Southern, Western and Northern regions.
The ORM offices will be closed for the Xmas / New Year period. From close of business Monday 23rd December 2019 and will re-open on Thursday 2nd January 2020.
Back to Top
Volume 5, September 2019
In this edition:
- A message from Phil
- Interest Rates – how do I know what rates should be available and when to fix?
- On-farm storage options
- Three tips for finding skilled labour
- Success in a challenging season – 2018: Tim Bateman
Update on happenings at ORM
This month we say farewell to Brett Symes, one of our Senior Agribusiness Consultants. Brett provided farm business consulting services and was involved in the planning and delivery of GRDC Grains Research Updates and industry specific extension events. Brett has been an integral part of the team for 13 years and we wish him and his family all the best for whatever story unfolds in the next chapter.
After a short stint with ORM we wish Liz Duncan all the best. Liz’s experience in corporate Australia and her management expertise were invaluable to the team. Liz is transitioning to contract work so we hope to work with her again at some time in the future. We wish Liz all the best for her future roles.
Volume 4, July 2019
In this edition:
- A message from Phil
- A Single Measure
- Grain Market Update – a quick look at domestic and global trends
- Should I own a truck?
- Calendar of Farm Business Events
Volume 3, May 2019
In this edition:
- A message from Phil
- Machinery – When should I upgrade?
- Employee engagement – Getting more from your team
- Calendar of Farm Business events
- When is tax time?
- Are you ready for Single Touch Payroll?
- Are you eligible for the On-farm Infrastructure Support Grant Program or Farm Household Allowance?
It’s always tax time, because managing tax is an ongoing strategy that shouldn’t be left to the end of the financial year. Early tax planning can save you thousands of dollars.
ORM can quickly and cost effectively generate early tax estimates with actuals to-date and estimates for the closing months. This then allows management to plan the timing of future income and expenditure to achieve multiple objectives. Besides minimising the amount of tax to pay, other considerations could be eligibility for government programs, such as income support, pensions, youth allowance, FHA, and more. FMD’s are a great tool to minimise tax in high profit years but withdrawing them tax-effectively in future years can cause headaches to a highly profitable business that’s accrued large deposits. Other tax effective strategies that are best planned early include:
- deferring income, whilst managing Bank limits
- timing of machinery purchases to ensure depreciation, instant asset write-off (items <$30,000) or immediate deductions (fencing, water facilities and fodder storage assets) can be claimed
- financial leasing of equipment over one year. Which machine?
- bringing a new beneficiary into averaging
Talk to those that run farming businesses too.
Contact ORM to discuss your business’s needs.
Volume 2, March 2019
In this edition:
- A message from Phil – annual reviews, the challenges of business management & the hot topics for April
- The economics of summer spraying – Tim Bateman
- Understanding the roles in trusts – Michele Chappel
- Employment Awards, Standards & Conditions – What does it all mean? Aleisha Dalmayer

ORM has recently completed a Summer/Autumn series of technical and business management events, many delivered on behalf of GRDC and some for our clients both at individual client meetings and groups.
Attendance at production related events has been strong, while events with a business management focus had lower attendance. Why are growers less inclined to attend forums on business management? As an industry we’ve made great advances in productivity and are continually fine tuning, however the challenges associated with managing seasonal volatility, rising costs per hectare, increased compliance requirements of employees and adoption of new technology to improve efficiency, all have significant impact on our business and yet do not seem to get the same level of attention.
ORM clients who do annual reviews can tick the box knowing they are addressing the business management aspects of their business. However, ORM’s goal is to also assist the grains and livestock industries to become more sustainable both from a financial, resource and people perspective. If you have ideas on ways to assist our industry address the business management challenge, or ideas to assist you or others to advance the sustainability of your business we’re ready to listen.
What’s hot:
- Checking employee contracts and pay rates to ensure compliance.
- The increased net worth of farming businesses due to growth in scale combined with rising land values, is changing the attitude of ‘off-farm’ children regarding their expectations to future entitlements.
- Banks are still lending but need stronger evidence of serviceability and including principal repayments.
- Carryover of grain and hay from the low prices of 2016/17 to the current high prices has been a good decision and resulted in strong equity growth.